  • Home
  • Faculty
    • Forms, Policies, Guidelines & Procedures
    • Cayuse
    • Intent To Submit a Proposal
    • Time and Effort (T&E)
    • Funding Opportunities
    • Research Insights
    • Office of Technology Commercialization
    • Laboratory Animal Resources (LAR)
    • Institutional Animal Care and Use Committee (IACUC)
    • Institutional Review Board (IRB)
    • Institutional Biosafety Committee (IBC)
    • Travel Resources and Investments Program (T.R.I.P.)
  • Students
  • Departments
    • Research Analytics
    • Research Administration
    • Research Integrity
    • Research Enhancement
    • Clinical Research
    • Research Operations
  • Analytics
    • ARGO
    • Control Tower
    • Datapulse
    • Degree Progression Monitoring (DPM)
    • Discovery Site
    • Facuty Insight
    • Academic Analytics
    • Reports and Dashboards
  • News
    • Latest News
    • Annual Reports
    • News Archive
  • About
    • Leadership
    • Research Pathways
    • Centers and Institutes
    • Meet the Senior Vice President for Research
    • Associate Deans for Research
    • Committees
    • Personnel
    • Office Locations
  • About
DIRECTORY
MAPS
MYUTRGV
UTRGV
The University of Texas
Rio Grande Valley
DIRECTORY
MAPS
MYUTRGV
News
GIVE
Open Search Menu
Menu
utrgv logo
Division of Research
  • Home
  • Faculty
    â–¼
    Faculty Square placeholder image 300px
    Faculty

    Streamlining research processes at UTRGV. Access tools and guidance for compliance, proposal submissions, funding, and more

    • Forms, Policies, Guidelines & Procedures
    • Cayuse
    • Intent To Submit a Proposal
    • Time and Effort (T&E)
    • Funding Opportunities
    • Research Insights
    • Office of Technology Commercialization
    • Laboratory Animal Resources (LAR)
    • Institutional Animal Care and Use Committee (IACUC)
    • Institutional Review Board (IRB)
    • Institutional Biosafety Committee (IBC)
    • Travel Resources and Investments Program (T.R.I.P.)
  • Students
  • Departments
    â–¼
    Departments Square placeholder image 300px
    Departments

    The Division of Research at UTRGV is dedicated to advancing and supporting the university's research activities, benefiting students, faculty, and staff.

    • Research Analytics
    • Research Administration
    • Research Integrity
    • Research Enhancement
    • Clinical Research
    • Research Operations
  • Analytics
    â–¼
    Analytics Square placeholder image 300px
    Analytics

    The Analytics Hub provides centralized access to key tools like ARGO, Control Tower, Data Pulse, DPM, and Academic Analytics, empowering data-driven decisions across research, academics, and operations at UTRGV.

    • ARGO
    • Control Tower
    • Datapulse
    • Degree Progression Monitoring (DPM)
    • UTRGV Discovery Site
    • UTRGV Facuty Insight
    • Academic Analytics
    • Reports and Dashboards
  • News
    â–¼
    News Square placeholder image 300px
    News

    Research Communications enhances the visibility and impact of research activities across UTRGV. Our mission is to ensure that UTRGV’s research reaches both internal and external audiences, enhancing the university’s research reputation.

    • Latest News
    • Annual Reports
    • News Archive
  • About
    â–¼
    About Square placeholder image 300px
    About

    Discover UTRGV’s Division of Research, supporting high-impact research and scholarship across all disciplines.

    • Leadership
    • Research Pathways
    • Centers and Institutes
    • Meet the Senior Vice President for Research
    • Associate Deans for Research
    • Committees
    • Personnel
    • Office Locations
  1. Home
  2. Departments
  3. Research Analytics
  4. NSF HERD
  5. NSF HERD Expenditure Tree Diagram: Analyzing Research Investment by Source and Discipline
In This Section
Menu

Research Analytics Menu

  • From Vision to Precision: UTRGV’s R1 Mission
  • Academic Analytics
  • ARGO
  • ARGO Dashboard
  • ARGO - Sponsored Program Intake
    • Approver Review Process
    • Communication Section
    • Compliance Section
    • Funding Source Section
    • How to Export a proposal as PDF
    • Key/Senior Personnel Section
    • Proposal Details Section
    • Proposal Information Section
    • Steps in the Key Personnel Review & Certifications Process
    • Submit for OSP Review Section
    • Subrecipient/Collaborator Section
    • Upload Documents Section
  • Carnegie Classification
    • Comparison Summary
    • Growth Rate by Institution
    • Year-over-Year (YoY) Growth Rate Comparison
  • Control Tower
  • Data Pulse
  • Data Storage and Computing
  • Degree Progression Monitoring
  • Doctoral Insights Engine
    • Dissertation Chairs Dashboard
    • Doctoral Students Info Dashboard
    • Doctoral Students Lifecycle
    • DPM Dashboard
    • Earn Rate Dashboard
    • Navigate Dashboard
  • Glossary
    • Function Glossary
    • NSF HERD - GLOSSARY
      • Type of Research
  • Grad College Smart Forms
  • IPEDS
    • Comparing Similar Institutions to UTRGV Based on Graduate Enrollment
    • Geographical Institution Graduate Enrollment
    • Institution Degree Awarded Over Time
    • Institution Degree Awarded Profile
    • Institution Fall Graduate Enrollment Over Time
    • Institution Fall Graduate Enrollment Profile
    • IPEDS data dictionary
    • Research Degrees Awarded Comparison
  • IRIS
  • NSF HERD
    • Tracking Institutional Research Expenditures Over Time
    • Comparative Summary: Benchmarking UTRGV
    • Geographical Distribution: Mapping Research Investment
    • Tree Diagram: Research by Source and Discipline
    • Expenditure by Source of Funds
    • Expenditure by Research Field/Discipline
  • Reports
    • Annual Report Dashboard
    • Awards and Proposal Summary
    • Expense Classification
    • IDC Dashboard
    • ORU Dashboard
    • Project Burn Rate
    • Project Listing
    • Proposal Approvals
    • Qualtrics DoR Survey Dashboards
    • Research Pathways & SPI Questions
    • Research Productivity
    • Weekly OSP Report
  • Training and Support
  • 30/60/90 - Day Pre-Closeout

Contact Us

Research Analytics
researchIT@utrgv.edu
(956)-882-4113

Quick Links

  • Forms, Policies & Guidelines
  • Staff Directory

NSF HERD Expenditure Tree Diagram: Analyzing Research Investment by Source and Discipline - Image

The Expenditure Tree Diagram page of the NSF HERD Dashboard provides a powerful, interactive way to understand how research funding is allocated across different levels, from total expenditure down to specific fields and funding sources. This visualization allows UTRGV and other institutions to analyze research spending in a detailed, hierarchical format, making it easier to see where funds are coming from and how they are allocated within different research disciplines.

Key Variables and Structure

The tree diagram organizes NSF HERD data into a hierarchical structure, allowing users to explore research expenditures by different categories, such as:

  1. Expenditure ($) and Percentage (%): Users can toggle between absolute dollar values (Expenditure) and percentages to see how much each category contributes to the total funding.
  2. Source of Funds: This breakdown shows where research funding originates, such as federal government, state government, institution funds, business, and non-profit organizations.
  3. Research Field/Discipline: This category divides research expenditures by field, such as life sciences, engineering, physical sciences, and more, helping to identify which disciplines receive the most funding.

By combining these variables, users can explore data at various levels of detail and gain a nuanced understanding of funding flows and research focus.

Total expenditure by year
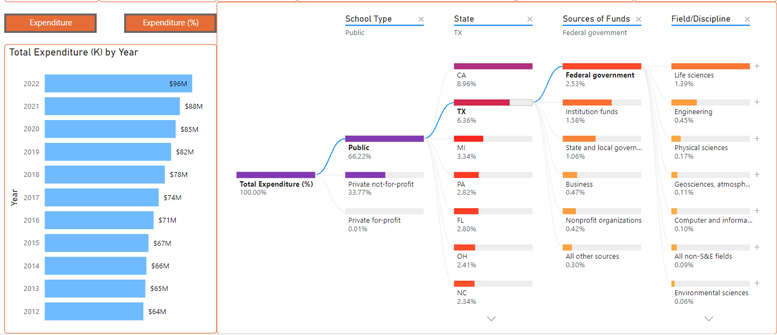
  1. Total Expenditure by Year (Bar Chart):
    • The bar chart on the left displays UTRGV’s total research expenditure over the years. This chart provides a quick view of funding trends, showing how research spending has grown annually. Users can track the progression from past years up to the most recent data (e.g., from $64M in 2012 to $96M in 2022).
  2. Expenditure Breakdown (Tree Diagram):
    • The tree diagram on the right is the main feature of this page. It begins with the total expenditure as the root and then breaks down into progressively smaller categories based on user selections.
    • Each level of the tree offers insights into the distribution of funds:
      • First Level: Divides spending by school type (e.g., Public, Private not-for-profit), showing how research funds are distributed across institutional types.
      • Second Level: Further categorizes expenditures by state to see which regions receive the most funding.
      • Third Level: Breaks down expenditures by source of funds (federal, state, institutional, private), showing the origin of the research investments.
      • Final Level: Divides funding into research fields/disciplines, revealing which academic areas, such as life sciences or engineering, receive the highest support.
        This diagram allows users to explore combinations of these categories to see how funds flow from sources to specific research areas, providing a holistic view of research funding distribution.

How to Use the Tree Diagram for Strategic Insights

The tree diagram enables UTRGV and other institutions to visualize and analyze their research funding distribution in-depth:

  • Identify Key Funding Sources: By breaking down expenditures by source, UTRGV can see the primary sources of its research funding, such as federal or institutional funds. This insight can guide future funding strategies and highlight areas where diversification may be beneficial.
  • Assess Investment by Discipline: Viewing expenditure by research discipline helps UTRGV identify which fields are well-funded and where there might be gaps or opportunities for growth. For instance, if life sciences are heavily funded, UTRGV might consider strengthening related programs.
  • Compare Institutional Types and Regions: The diagram also allows for comparisons across school types and states, giving UTRGV a broader perspective on how it aligns with national trends in research funding and where it stands relative to other public institutions.

Purpose of the Tree Diagram for UTRGV’s Research Goals

The Expenditure Tree Diagram is a critical tool for strategic planning and resource allocation. It provides a clear, hierarchical view of how research funds are distributed, from broad categories down to specific fields and sources. By examining this breakdown, UTRGV can:

  • Benchmark Its Research Spending: Understanding how funds are allocated across disciplines and funding sources helps UTRGV gauge its alignment with peer institutions.
  • Inform Future Funding Requests: Insights from the tree diagram can support targeted funding requests, helping UTRGV demonstrate the need for support in underfunded areas or for growing successful programs.
  • Strengthen Research Investment Strategy: With a clear view of funding sources and discipline allocations, UTRGV can make informed decisions on where to invest to enhance its research profile and support its strategic goals.

The NSF HERD Expenditure Tree Diagram is an essential tool for UTRGV to understand and optimize its research funding strategy. By offering a detailed look at funding sources and allocations, this visualization helps UTRGV align with its research ambitions and enhance its position as a competitive research institution.


Division of Research


Brownsville

research@utrgv.edu
BBRHB 2.210

(956)-296-1549

Edinburg

research@utrgv.edu
ESSBL 5.110

(956)-665-3883

Hours

Monday - Friday
8:00 AM - 5:00 PM CST

Find us on Social Media


LIKE. FOLLOW. SUBSCRIBE. ADD.


UTRGV
  • CARES, CRRSAA and ARP Reporting
  • Site Policies
  • Required Links
  • Accreditation Statement
  • Fraud Reporting
  • Senate Bill 18
  • Clery Act Reports
  • Web Accessibility
  • Mental Health Resources
  • Sexual Misconduct Policy
  • Reporting Sexual Misconduct
  • Contact UTRGV
  • 1-844-ATUTRGV
  • Facebook
  • X Twitter
  • Instagram
  • LinkedIn
  • Academics
  • Admissions
  • Cost and Financial Aid
  • Student Life
  • Search Programs
  • First-Year Students
  • Transfer
  • International Students
  • Graduate Students
  • Current Students
  • Faculty Resources
  • Staff Resources
  • UTRGV Careers
  • Visit Campus
  • Directory
The University of Texas Rio Grande Valley