  • Home
  • Faculty
    • Forms, Policies, Guidelines & Procedures
    • Cayuse
    • Intent To Submit a Proposal
    • Time and Effort (T&E)
    • Funding Opportunities
    • Research Insights
    • Office of Technology Commercialization
    • Laboratory Animal Resources (LAR)
    • Institutional Animal Care and Use Committee (IACUC)
    • Institutional Review Board (IRB)
    • Institutional Biosafety Committee (IBC)
    • Travel Resources and Investments Program (T.R.I.P.)
  • Students
  • Departments
    • Research Analytics
    • Research Administration
    • Research Integrity
    • Research Enhancement
    • Clinical Research
    • Research Operations
  • Analytics
    • ARGO
    • Control Tower
    • Datapulse
    • Degree Progression Monitoring (DPM)
    • Discovery Site
    • Facuty Insight
    • Academic Analytics
    • Reports and Dashboards
  • News
    • Latest News
    • Annual Reports
    • News Archive
  • About
    • Leadership
    • Research Pathways
    • Centers and Institutes
    • Meet the Senior Vice President for Research
    • Associate Deans for Research
    • Committees
    • Personnel
    • Office Locations
  • About
DIRECTORY
MAPS
MYUTRGV
UTRGV
The University of Texas
Rio Grande Valley
DIRECTORY
MAPS
MYUTRGV
News
GIVE
Open Search Menu
Menu
utrgv logo
Division of Research
  • Home
  • Faculty
    â–Ľ
    Faculty Square placeholder image 300px
    Faculty

    Streamlining research processes at UTRGV. Access tools and guidance for compliance, proposal submissions, funding, and more

    • Forms, Policies, Guidelines & Procedures
    • Cayuse
    • Intent To Submit a Proposal
    • Time and Effort (T&E)
    • Funding Opportunities
    • Research Insights
    • Office of Technology Commercialization
    • Laboratory Animal Resources (LAR)
    • Institutional Animal Care and Use Committee (IACUC)
    • Institutional Review Board (IRB)
    • Institutional Biosafety Committee (IBC)
    • Travel Resources and Investments Program (T.R.I.P.)
  • Students
  • Departments
    â–Ľ
    Departments Square placeholder image 300px
    Departments

    The Division of Research at UTRGV is dedicated to advancing and supporting the university's research activities, benefiting students, faculty, and staff.

    • Research Analytics
    • Research Administration
    • Research Integrity
    • Research Enhancement
    • Clinical Research
    • Research Operations
  • Analytics
    â–Ľ
    Analytics Square placeholder image 300px
    Analytics

    The Analytics Hub provides centralized access to key tools like ARGO, Control Tower, Data Pulse, DPM, and Academic Analytics, empowering data-driven decisions across research, academics, and operations at UTRGV.

    • ARGO
    • Control Tower
    • Datapulse
    • Degree Progression Monitoring (DPM)
    • UTRGV Discovery Site
    • UTRGV Facuty Insight
    • Academic Analytics
    • Reports and Dashboards
  • News
    â–Ľ
    News Square placeholder image 300px
    News

    Research Communications enhances the visibility and impact of research activities across UTRGV. Our mission is to ensure that UTRGV’s research reaches both internal and external audiences, enhancing the university’s research reputation.

    • Latest News
    • Annual Reports
    • News Archive
  • About
    â–Ľ
    About Square placeholder image 300px
    About

    Discover UTRGV’s Division of Research, supporting high-impact research and scholarship across all disciplines.

    • Leadership
    • Research Pathways
    • Centers and Institutes
    • Meet the Senior Vice President for Research
    • Associate Deans for Research
    • Committees
    • Personnel
    • Office Locations
  1. Home
  2. Departments
  3. Research Analytics
  4. NSF HERD
  5. Tracking Institutional Research Expenditures Over Time
In This Section
Menu

Research Analytics Menu

  • From Vision to Precision: UTRGV’s R1 Mission
  • Academic Analytics
  • ARGO
  • ARGO Dashboard
  • ARGO - Sponsored Program Intake
    • Approver Review Process
    • Communication Section
    • Compliance Section
    • Funding Source Section
    • How to Export a proposal as PDF
    • Key/Senior Personnel Section
    • Proposal Details Section
    • Proposal Information Section
    • Steps in the Key Personnel Review & Certifications Process
    • Submit for OSP Review Section
    • Subrecipient/Collaborator Section
    • Upload Documents Section
  • Carnegie Classification
    • Comparison Summary
    • Growth Rate by Institution
    • Year-over-Year (YoY) Growth Rate Comparison
  • Control Tower
  • Data Pulse
  • Data Storage and Computing
  • Degree Progression Monitoring
  • Doctoral Insights Engine
    • Dissertation Chairs Dashboard
    • Doctoral Students Info Dashboard
    • Doctoral Students Lifecycle
    • DPM Dashboard
    • Earn Rate Dashboard
    • Navigate Dashboard
  • Glossary
    • Function Glossary
    • NSF HERD - GLOSSARY
      • Type of Research
  • Grad College Smart Forms
  • IPEDS
    • Comparing Similar Institutions to UTRGV Based on Graduate Enrollment
    • Geographical Institution Graduate Enrollment
    • Institution Degree Awarded Over Time
    • Institution Degree Awarded Profile
    • Institution Fall Graduate Enrollment Over Time
    • Institution Fall Graduate Enrollment Profile
    • IPEDS data dictionary
    • Research Degrees Awarded Comparison
  • IRIS
  • NSF HERD
    • Tracking Institutional Research Expenditures Over Time
    • Comparative Summary: Benchmarking UTRGV
    • Geographical Distribution: Mapping Research Investment
    • Tree Diagram: Research by Source and Discipline
    • Expenditure by Source of Funds
    • Expenditure by Research Field/Discipline
  • Reports
    • Annual Report Dashboard
    • Awards and Proposal Summary
    • Expense Classification
    • IDC Dashboard
    • ORU Dashboard
    • Project Burn Rate
    • Project Listing
    • Proposal Approvals
    • Qualtrics DoR Survey Dashboards
    • Research Pathways & SPI Questions
    • Research Productivity
    • Weekly OSP Report
  • Training and Support
  • 30/60/90 - Day Pre-Closeout

Contact Us

Research Analytics
researchIT@utrgv.edu
(956)-882-4113

Quick Links

  • Forms, Policies & Guidelines
  • Staff Directory

Year-over-Year (YoY) Growth Analysis: Tracking Institutional Research Expenditures Over Time

The YoY Growth Analysis page in the NSF HERD Dashboard provides a comprehensive view of how research spending has evolved over time for various institutions, with detailed breakdowns of year-over-year expenditure changes. This tool is essential for understanding how UTRGV’s research investment compares to peer institutions and for tracking its progress in research funding over time.

Key Variables

  1. YoY Change:
    • YoY (Year-over-Year) Change is calculated by comparing the current year’s research expenditure to the previous year’s, expressed as a percentage. For example, if an institution’s expenditure grows from $85M in 2021 to $95M in 2022, the YoY change rate would be 9.11%.
    • This metric helps users quickly identify whether research funding at an institution is growing or declining over time, offering insight into trends in research investment.
  2. Rank:
    • Each institution is assigned a rank based on its research expenditure, according to NSF HERD data.
    • Users can also explore Neighbors by Rank, which shows institutions within a rank range of -10 to +10 from UTRGV’s rank. This feature is valuable for comparing UTRGV’s expenditure trends to similar institutions, helping stakeholders understand UTRGV’s competitive standing. 

Visualizations

ranks image
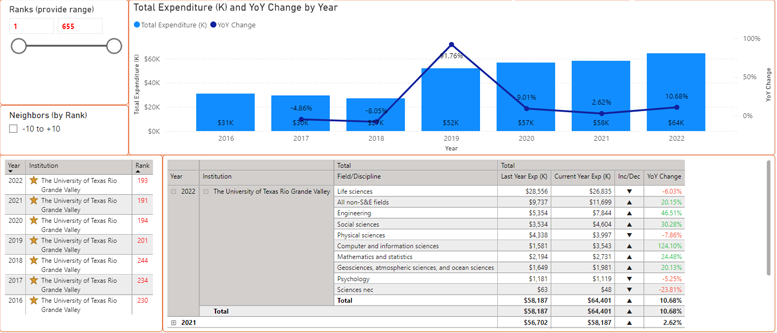
  1. Bar Chart with Line Graph:
    • The main graph on this page combines bar and line charts to show both the dollar amount of total expenditure (bar) and the YoY change rate (line) for each year.
    • Each bar represents the total expenditure for a particular year, allowing users to see the overall growth trend in dollar terms. The line graph above the bars tracks the YoY percentage change, showing whether spending increased or decreased relative to the previous year.
    • This dual-view setup enables users to see not only the total amount of research funding but also how fast it’s growing or contracting annually. For example, UTRGV’s research expenditure increased by 10.68% from 2021 to 2022, reflecting significant growth in research funding.
  2. Ranking Table and YoY Change Matrix:
    • This table displays a list of institutions along with their rank, expenditure for the current year, and YoY change rate. The matrix view provides a breakdown of how each institution’s rank and expenditure changed over time.
    • Users can see each institution’s ranking and YoY changes in detail, making it easy to compare performance between institutions. Additionally, the table highlights each institution’s expenditure across different funding sources and research fields, allowing for a granular analysis of where funds are allocated.

How to Use the YoY Growth Analysis for Strategic Insights

The YoY Growth Analysis page offers powerful insights for UTRGV’s strategic planning in research. By exploring this data, UTRGV can:

  • Track Growth Over Time: The bar and line chart allow UTRGV to monitor its own spending growth year-over-year, making it easy to see the rate of research investment increase.
  • Benchmark Against Peers: With the Neighbors by Rank feature, UTRGV can quickly compare its YoY growth and funding levels with institutions of similar rank, gaining insights into competitive positioning.
  • Identify Funding Trends: The detailed table enables a closer look at UTRGV’s funding sources and research fields, helping to assess if UTRGV’s funding portfolio aligns with growth areas or if adjustments might be needed to support priority fields.

Purpose of the YoY Growth Analysis for UTRGV’s Research Goals

This page is an essential resource for UTRGV to evaluate its research expenditure growth and its standing among peer institutions. By analyzing YoY changes, UTRGV can make informed decisions on where to prioritize resources, identify successful growth areas, and track progress toward research excellence.

The YoY Growth Analysis is more than just a snapshot; it’s a strategic tool that provides actionable insights into UTRGV’s research funding trajectory. As UTRGV works to enhance its research profile and move up in the rankings, understanding these growth metrics is critical for setting realistic goals and measuring progress.


Division of Research


Brownsville

research@utrgv.edu
BBRHB 2.210

(956)-296-1549

Edinburg

research@utrgv.edu
ESSBL 5.110

(956)-665-3883

Hours

Monday - Friday
8:00 AM - 5:00 PM CST

Find us on Social Media


LIKE. FOLLOW. SUBSCRIBE. ADD.


UTRGV
  • CARES, CRRSAA and ARP Reporting
  • Site Policies
  • Required Links
  • Accreditation Statement
  • Fraud Reporting
  • Senate Bill 18
  • Clery Act Reports
  • Web Accessibility
  • Mental Health Resources
  • Sexual Misconduct Policy
  • Reporting Sexual Misconduct
  • Contact UTRGV
  • 1-844-ATUTRGV
  • Facebook
  • X Twitter
  • Instagram
  • LinkedIn
  • Academics
  • Admissions
  • Cost and Financial Aid
  • Student Life
  • Search Programs
  • First-Year Students
  • Transfer
  • International Students
  • Graduate Students
  • Current Students
  • Faculty Resources
  • Staff Resources
  • UTRGV Careers
  • Visit Campus
  • Directory
The University of Texas Rio Grande Valley