  • Home
  • Faculty
    • Forms, Policies, Guidelines & Procedures
    • Cayuse
    • Intent To Submit a Proposal
    • Time and Effort (T&E)
    • Funding Opportunities
    • Research Insights
    • Office of Technology Commercialization
    • Laboratory Animal Resources (LAR)
    • Institutional Animal Care and Use Committee (IACUC)
    • Institutional Review Board (IRB)
    • Institutional Biosafety Committee (IBC)
    • Travel Resources and Investments Program (T.R.I.P.)
  • Students
  • Departments
    • Research Analytics
    • Research Administration
    • Research Integrity
    • Research Enhancement
    • Clinical Research
    • Research Operations
  • Analytics
    • ARGO
    • Control Tower
    • Datapulse
    • Degree Progression Monitoring (DPM)
    • Discovery Site
    • Facuty Insight
    • Academic Analytics
    • Reports and Dashboards
  • News
    • Latest News
    • Annual Reports
    • News Archive
  • About
    • Leadership
    • Research Pathways
    • Centers and Institutes
    • Meet the Senior Vice President for Research
    • Associate Deans for Research
    • Committees
    • Personnel
    • Office Locations
  • About
DIRECTORY
MAPS
MYUTRGV
UTRGV
The University of Texas
Rio Grande Valley
DIRECTORY
MAPS
MYUTRGV
News
GIVE
Open Search Menu
Menu
utrgv logo
Division of Research
  • Home
  • Faculty
    â–Ľ
    Faculty Square placeholder image 300px
    Faculty

    Streamlining research processes at UTRGV. Access tools and guidance for compliance, proposal submissions, funding, and more

    • Forms, Policies, Guidelines & Procedures
    • Cayuse
    • Intent To Submit a Proposal
    • Time and Effort (T&E)
    • Funding Opportunities
    • Research Insights
    • Office of Technology Commercialization
    • Laboratory Animal Resources (LAR)
    • Institutional Animal Care and Use Committee (IACUC)
    • Institutional Review Board (IRB)
    • Institutional Biosafety Committee (IBC)
    • Travel Resources and Investments Program (T.R.I.P.)
  • Students
  • Departments
    â–Ľ
    Departments Square placeholder image 300px
    Departments

    The Division of Research at UTRGV is dedicated to advancing and supporting the university's research activities, benefiting students, faculty, and staff.

    • Research Analytics
    • Research Administration
    • Research Integrity
    • Research Enhancement
    • Clinical Research
    • Research Operations
  • Analytics
    â–Ľ
    Analytics Square placeholder image 300px
    Analytics

    The Analytics Hub provides centralized access to key tools like ARGO, Control Tower, Data Pulse, DPM, and Academic Analytics, empowering data-driven decisions across research, academics, and operations at UTRGV.

    • ARGO
    • Control Tower
    • Datapulse
    • Degree Progression Monitoring (DPM)
    • UTRGV Discovery Site
    • UTRGV Facuty Insight
    • Academic Analytics
    • Reports and Dashboards
  • News
    â–Ľ
    News Square placeholder image 300px
    News

    Research Communications enhances the visibility and impact of research activities across UTRGV. Our mission is to ensure that UTRGV’s research reaches both internal and external audiences, enhancing the university’s research reputation.

    • Latest News
    • Annual Reports
    • News Archive
  • About
    â–Ľ
    About Square placeholder image 300px
    About

    Discover UTRGV’s Division of Research, supporting high-impact research and scholarship across all disciplines.

    • Leadership
    • Research Pathways
    • Centers and Institutes
    • Meet the Senior Vice President for Research
    • Associate Deans for Research
    • Committees
    • Personnel
    • Office Locations
  1. Home
  2. Departments
  3. Research Analytics
  4. IPEDS
  5. blank-sub-page
In This Section
Menu

Research Analytics Menu

  • From Vision to Precision: UTRGV’s R1 Mission
  • Academic Analytics
  • ARGO
  • ARGO Dashboard
  • ARGO - Sponsored Program Intake
    • Approver Review Process
    • Communication Section
    • Compliance Section
    • Funding Source Section
    • How to Export a proposal as PDF
    • Key/Senior Personnel Section
    • Proposal Details Section
    • Proposal Information Section
    • Steps in the Key Personnel Review & Certifications Process
    • Submit for OSP Review Section
    • Subrecipient/Collaborator Section
    • Upload Documents Section
  • Carnegie Classification
    • Comparison Summary
    • Growth Rate by Institution
    • Year-over-Year (YoY) Growth Rate Comparison
  • Control Tower
  • Data Pulse
  • Data Storage and Computing
  • Degree Progression Monitoring
  • Doctoral Insights Engine
    • Dissertation Chairs Dashboard
    • Doctoral Students Info Dashboard
    • Doctoral Students Lifecycle
    • DPM Dashboard
    • Earn Rate Dashboard
    • Navigate Dashboard
  • Glossary
    • Function Glossary
    • NSF HERD - GLOSSARY
      • Type of Research
  • Grad College Smart Forms
  • IPEDS
    • Comparing Similar Institutions to UTRGV Based on Graduate Enrollment
    • Geographical Institution Graduate Enrollment
    • Institution Degree Awarded Over Time
    • Institution Degree Awarded Profile
    • Institution Fall Graduate Enrollment Over Time
    • Institution Fall Graduate Enrollment Profile
    • IPEDS data dictionary
    • Research Degrees Awarded Comparison
  • IRIS
  • NSF HERD
    • Tracking Institutional Research Expenditures Over Time
    • Comparative Summary: Benchmarking UTRGV
    • Geographical Distribution: Mapping Research Investment
    • Tree Diagram: Research by Source and Discipline
    • Expenditure by Source of Funds
    • Expenditure by Research Field/Discipline
  • Reports
    • Annual Report Dashboard
    • Awards and Proposal Summary
    • Expense Classification
    • IDC Dashboard
    • ORU Dashboard
    • Project Burn Rate
    • Project Listing
    • Proposal Approvals
    • Qualtrics DoR Survey Dashboards
    • Research Pathways & SPI Questions
    • Research Productivity
    • Weekly OSP Report
  • Training and Support
  • 30/60/90 - Day Pre-Closeout

Contact Us

Research Analytics
researchIT@utrgv.edu
(956)-882-4113

Quick Links

  • Forms, Policies & Guidelines
  • Staff Directory

Institution Fall Graduate Enrollment Over Time

The "Institution Fall Graduate Enrollment Over Time" section of the dashboard offers a longitudinal view of graduate enrollment patterns at the University of Texas Rio Grande Valley (UTRGV). This page helps stakeholders analyze how full-time and part-time graduate student enrollments have changed over recent years and provides a demographic breakdown of gender and ethnicity trends.

Relevant Variables:

  • Graduate Enrollment Level: Separates students into Full-Time Graduate Students and Part-Time Graduate Students, allowing users to observe enrollment dynamics across these two categories.

Visualizations:

Institution Fall Graduate Enrollment Over Time
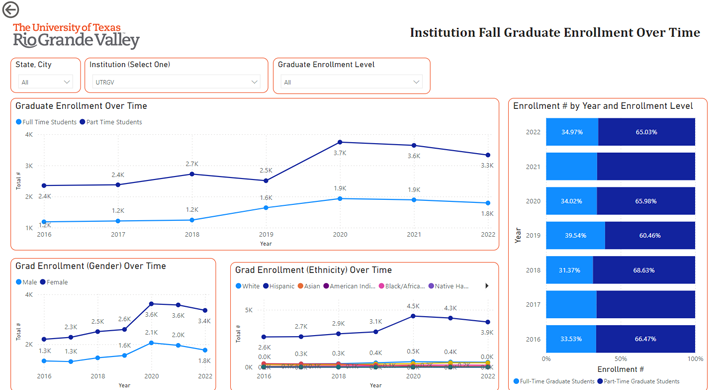
  1. Line Chart (Graduate Enrollment Over Time): This line chart visualizes trends in full-time and part-time graduate enrollments from 2016 to 2022. The lines show year-over-year changes, making it easy to spot growth or declines in each category. For example, users can see if there has been a shift in students opting for part-time or full-time enrollment over the years.
  2. Stacked Bar Chart (Enrollment # by Year and Enrollment Level): This stacked bar chart shows the percentage split between full-time and part-time graduate students each year. Each bar represents a year, with sections for full-time and part-time enrollment. This format allows users to observe whether the distribution between full-time and part-time students remains consistent or shifts over time.
  3. Line Chart (Graduate Enrollment by Gender Over Time): This chart breaks down the enrollment trends by gender (male and female) over time. Each line represents one gender, providing a clear view of enrollment patterns among male and female students from 2016 to 2022. Users can observe changes in gender representation within the graduate student population.
  4. Line Chart (Graduate Enrollment by Ethnicity Over Time): This chart tracks the enrollment of various racial/ethnic groups over the years. Each line represents a different demographic group, allowing users to see how enrollment among each group has evolved over time. This visual is particularly useful for understanding diversity trends within UTRGV's graduate programs.

Overall Functionality: This page offers a comprehensive view of how UTRGV's graduate enrollment has evolved over time, segmented by enrollment status, gender, and ethnicity. By providing these breakdowns, the dashboard allows administrators and stakeholders to monitor trends, assess the impact of demographic shifts, and make informed decisions about recruitment, retention, and diversity initiatives. This information is valuable for setting strategic goals to support graduate student growth and inclusivity at UTRGV.

Division of Research


Brownsville

research@utrgv.edu
BBRHB 2.210

(956)-296-1549

Edinburg

research@utrgv.edu
ESSBL 5.110

(956)-665-3883

Hours

Monday - Friday
8:00 AM - 5:00 PM CST

Find us on Social Media


LIKE. FOLLOW. SUBSCRIBE. ADD.


UTRGV
  • CARES, CRRSAA and ARP Reporting
  • Site Policies
  • Required Links
  • Accreditation Statement
  • Fraud Reporting
  • Senate Bill 18
  • Clery Act Reports
  • Web Accessibility
  • Mental Health Resources
  • Sexual Misconduct Policy
  • Reporting Sexual Misconduct
  • Contact UTRGV
  • 1-844-ATUTRGV
  • Facebook
  • X Twitter
  • Instagram
  • LinkedIn
  • Academics
  • Admissions
  • Cost and Financial Aid
  • Student Life
  • Search Programs
  • First-Year Students
  • Transfer
  • International Students
  • Graduate Students
  • Current Students
  • Faculty Resources
  • Staff Resources
  • UTRGV Careers
  • Visit Campus
  • Directory
The University of Texas Rio Grande Valley