
Geographical Institution Graduate Enrollment
Research Analytics Menu
- 30/60/90 - Day Pre-Closeout
- Academic Analytics
- ARGO
-
ARGO - Sponsored Program Intake
- Approver Review Process
- Communication Section
- Compliance Section
- Funding Source Section
- How to Export a proposal as PDF
- Key/Senior Personnel Section
- Proposal Details Section
- Proposal Information Section
- Steps in the Key Personnel Review & Certifications Process
- Submit for OSP Review Section
- Subrecipient/Collaborator Section
- Upload Documents Section
- ARGO Dashboard
- Carnegie Classification
- Control Tower
- Data Pulse
- Data Storage and Computing
- Doctoral Insights Engine
- From Vision to Precision: UTRGV’s R1 Mission
- Glossary
- Graduate Course Demand Tracker
- Graduate Help Desk
- Graduate Services Portal
-
IPEDS
- Comparing Similar Institutions to UTRGV Based on Graduate Enrollment
- Geographical Institution Graduate Enrollment
- Institution Degree Awarded Over Time
- Institution Degree Awarded Profile
- Institution Fall Graduate Enrollment Over Time
- Institution Fall Graduate Enrollment Profile
- IPEDS data dictionary
- Research Degrees Awarded Comparison
- Institute for Research on Innovation and Science (IRIS)
- NSF HERD
- Post-Award Request Portal
- Prompt Report Form
-
Reports
- Annual Report Dashboard
- Awards and Proposal Summary
- Expense Classification
- IDC Dashboard
- ORU Dashboard
- Project Burn Rate
- Project Listing
- Proposal Approvals
- Qualtrics DoR Survey Dashboards
- Research Pathways & SPI Questions
- Research Productivity
- Weekly OPS Report
- Space Utilization Dashboard
- Graduate Student Recruitment Dashboard
- Research Compliance Training
- Training and Support
Quick Links
Geographical Institution Graduate Enrollment
The "Geographical Institution Graduate Enrollment" section of the IPEDS Degrees & Enrollment dashboard provides a national overview of graduate enrollment across various institutions in the United States. It highlights the distribution of enrolled graduate students by geographic location, allowing users to explore where concentrations of graduate enrollment are highest and identify institutions with significant graduate populations.
Relevant Variables:
- Graduate Enrollment Level: Displays total enrollment figures, distinguishing between full-time and part-time graduate students.
- Groups by Expenditures: Categorizes institutions based on their reported expenditures, helping users understand enrollment patterns relative to institutional spending.
Visualizations:
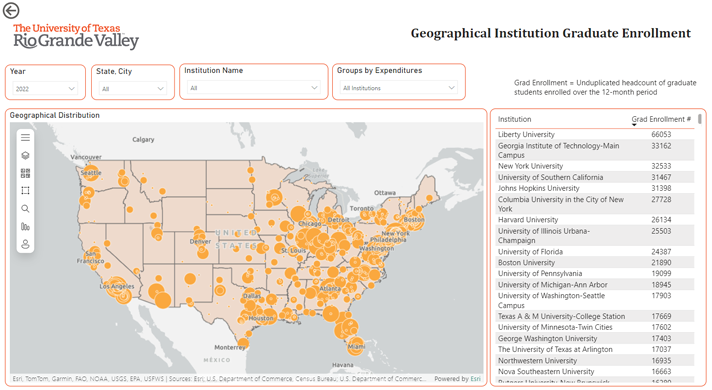
- ArcGIS Map: This interactive map displays institutions across the country, with each represented by an orange bubble. The size of each bubble indicates the graduate enrollment at that institution, so larger bubbles correspond to higher enrollment numbers. Users can zoom in on specific states or regions to view institutions within that area. The map makes it easy to identify major hubs of graduate enrollment and explore regional patterns.
- Info Table: Alongside the map, this table lists institutions with their corresponding graduate enrollment figures, enabling users to easily scan and compare enrollment numbers. Institutions with the largest graduate enrollments are listed at the top, providing a quick reference to identify the top graduate education providers nationwide.
Overall Functionality: This section is designed to give a clear, visual representation of graduate enrollment across the U.S., making it easy for stakeholders to assess the geographic distribution of graduate education. By understanding where large populations of graduate students are concentrated, UTRGV can benchmark its enrollment against other institutions, gain insights into regional enrollment trends, and consider factors like expenditure to better position itself within the graduate education landscape. This analysis is valuable for strategic planning, identifying potential areas of growth, and ensuring that UTRGV remains competitive and well-aligned with nationwide trends in graduate education.