
Institution Degree Awarded Profile
Research Analytics Menu
- 30/60/90 - Day Pre-Closeout
- Academic Analytics
- ARGO
-
ARGO - Sponsored Program Intake
- Approver Review Process
- Communication Section
- Compliance Section
- Funding Source Section
- How to Export a proposal as PDF
- Key/Senior Personnel Section
- Proposal Details Section
- Proposal Information Section
- Steps in the Key Personnel Review & Certifications Process
- Submit for OSP Review Section
- Subrecipient/Collaborator Section
- Upload Documents Section
- ARGO Dashboard
- Carnegie Classification
- Control Tower
- Data Pulse
- Data Storage and Computing
- Doctoral Insights Engine
- From Vision to Precision: UTRGV’s R1 Mission
- Glossary
- Graduate Course Demand Tracker
- Graduate Help Desk
- Graduate Services Portal
-
IPEDS
- Comparing Similar Institutions to UTRGV Based on Graduate Enrollment
- Geographical Institution Graduate Enrollment
- Institution Degree Awarded Over Time
- Institution Degree Awarded Profile
- Institution Fall Graduate Enrollment Over Time
- Institution Fall Graduate Enrollment Profile
- IPEDS data dictionary
- Research Degrees Awarded Comparison
- Institute for Research on Innovation and Science (IRIS)
- NSF HERD
- Post-Award Request Portal
- Prompt Report Form
-
Reports
- Annual Report Dashboard
- Awards and Proposal Summary
- Expense Classification
- IDC Dashboard
- ORU Dashboard
- Project Burn Rate
- Project Listing
- Proposal Approvals
- Qualtrics DoR Survey Dashboards
- Research Pathways & SPI Questions
- Research Productivity
- Weekly OPS Report
- Space Utilization Dashboard
- Graduate Student Recruitment Dashboard
- Research Compliance Training
- Training and Support
Quick Links
Institution Degree Awarded Profile
The "Institution Degree Awarded Profile" section offers a detailed look at the doctoral degrees awarded by UTRGV in specific academic programs. This part of the IPEDS Degrees & Enrollment dashboard provides insights into the types and distribution of doctoral degrees awarded, helping stakeholders understand the focus areas and reach of UTRGV’s doctoral programs.
Relevant Variables:
- CIP Code: The Classification of Instructional Programs (CIP) Code, created by the U.S. Department of Education, organizes academic programs into categories, making it easier to compare and analyze similar programs across institutions.
- Degree Title: Each CIP code corresponds to a degree title, such as "Medicine," "Nursing Practice," or "Business Administration," allowing users to see the specific areas in which UTRGV awards degrees.
- Award Level: This variable categorizes degrees into types, including Research/Scholarship and Professional Practice, highlighting the range of doctoral-level education provided by UTRGV.
Visualizations:
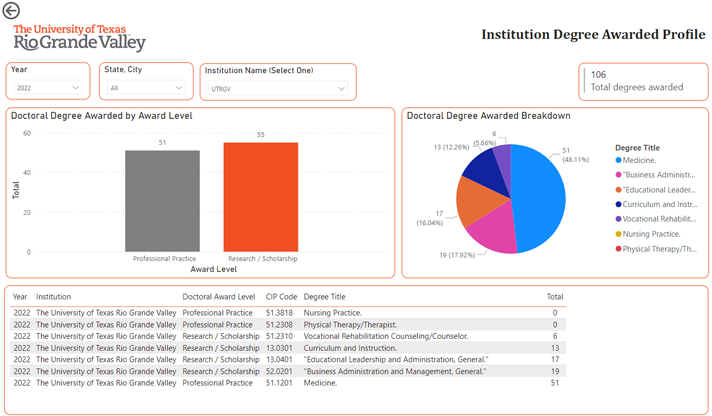
- Bar Chart: The bar chart displays the number of degrees awarded at different levels, comparing Professional Practice and Research/Scholarship degrees. This helps users see the emphasis UTRGV places on each type of doctoral education, whether it be practice-oriented or research-focused.
- Pie Chart: The pie chart breaks down the degrees awarded by degree title, with each segment representing a specific field. For example, the chart might show the proportion of degrees awarded in Medicine, Business Administration, or Nursing Practice. This visual provides a clear view of UTRGV's areas of specialization within its doctoral programs.
Overall Functionality: This profile enables users to explore UTRGV’s doctoral degree offerings in depth. By displaying degrees awarded by field and award level, the dashboard highlights UTRGV’s strengths in various disciplines, showcasing its contributions to professional and scholarly education. This data aids in strategic planning and helps stakeholders identify trends in degree completion, supporting UTRGV’s goals in research and professional education.