
Institution Degree Awarded Over Time
Research Analytics Menu
- 30/60/90 - Day Pre-Closeout
- Academic Analytics
- ARGO
-
ARGO - Sponsored Program Intake
- Approver Review Process
- Communication Section
- Compliance Section
- Funding Source Section
- How to Export a proposal as PDF
- Key/Senior Personnel Section
- Proposal Details Section
- Proposal Information Section
- Steps in the Key Personnel Review & Certifications Process
- Submit for OSP Review Section
- Subrecipient/Collaborator Section
- Upload Documents Section
- ARGO Dashboard
- Carnegie Classification
- Control Tower
- Data Pulse
- Data Storage and Computing
- Doctoral Insights Engine
- From Vision to Precision: UTRGV’s R1 Mission
- Glossary
- Graduate Course Demand Tracker
- Graduate Help Desk
- Graduate Services Portal
-
IPEDS
- Comparing Similar Institutions to UTRGV Based on Graduate Enrollment
- Geographical Institution Graduate Enrollment
- Institution Degree Awarded Over Time
- Institution Degree Awarded Profile
- Institution Fall Graduate Enrollment Over Time
- Institution Fall Graduate Enrollment Profile
- IPEDS data dictionary
- Research Degrees Awarded Comparison
- Institute for Research on Innovation and Science (IRIS)
- NSF HERD
- Post-Award Request Portal
- Prompt Report Form
-
Reports
- Annual Report Dashboard
- Awards and Proposal Summary
- Expense Classification
- IDC Dashboard
- ORU Dashboard
- Project Burn Rate
- Project Listing
- Proposal Approvals
- Qualtrics DoR Survey Dashboards
- Research Pathways & SPI Questions
- Research Productivity
- Weekly OPS Report
- Space Utilization Dashboard
- Graduate Student Recruitment Dashboard
- Research Compliance Training
- Training and Support
Quick Links
Institution Degree Awarded Over Time
The "Institution Degree Awarded Over Time" section of the IPEDS Degrees & Enrollment dashboard allows users to track the number of doctoral degrees awarded by UTRGV across multiple years. This section provides valuable insights into the university’s growth in doctoral education, showcasing trends in both professional practice and research/scholarship degree programs.
Relevant Variables:
- Award Level: Differentiates between degrees awarded for Research/Scholarship and Professional Practice, allowing users to see how UTRGV's focus areas have evolved.
- Degree Title: The specific name of each degree awarded, aligned with a CIP code, providing clarity on the fields in which UTRGV awards doctoral degrees.
Visualizations:
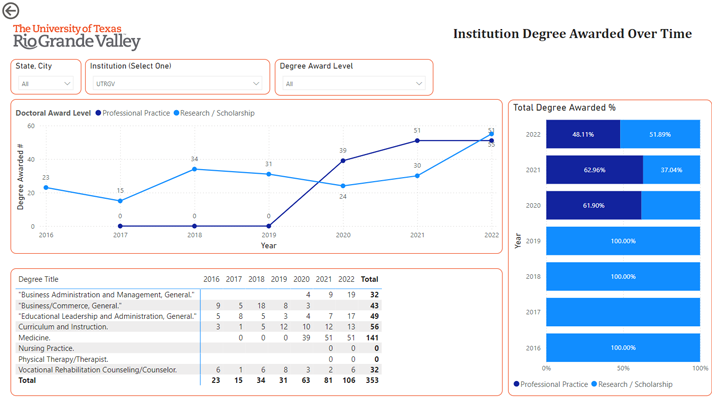
- Line Chart: This line chart visualizes the trends in the number of degrees awarded over time, separated by Award Level (Professional Practice and Research/Scholarship). By observing the lines, users can easily spot growth or decline in particular types of degrees. For instance, a steady increase in Research/Scholarship degrees over recent years may indicate UTRGV's strengthening focus on research.
- Bar Chart (Total Degree Awarded Percentage): This stacked bar chart represents the percentage distribution between Professional Practice and Research/Scholarship degrees each year. This helps users see the balance between different types of doctoral education at a glance and how it has shifted over time.
- Degree Title Matrix: This matrix lists specific degree titles awarded by UTRGV each year, displaying counts for each title by year. Users can track individual programs, such as "Nursing Practice" or "Business Administration," and see how they have expanded or contracted, helping to identify UTRGV’s strategic priorities in specific fields.
Overall Functionality: This section serves as a longitudinal view of UTRGV’s doctoral program offerings. By displaying degree awards over time, it helps stakeholders understand trends in UTRGV's doctoral education. This data supports decision-making around program growth, resource allocation, and strategic focus areas, reinforcing UTRGV's commitment to its mission in both professional and scholarly domains.