
Comparing Similar Institutions to UTRGV Based on Graduate Enrollment
Research Analytics Menu
- 30/60/90 - Day Pre-Closeout
- Academic Analytics
- ARGO
-
ARGO - Sponsored Program Intake
- Approver Review Process
- Communication Section
- Compliance Section
- Funding Source Section
- How to Export a proposal as PDF
- Key/Senior Personnel Section
- Proposal Details Section
- Proposal Information Section
- Steps in the Key Personnel Review & Certifications Process
- Submit for OSP Review Section
- Subrecipient/Collaborator Section
- Upload Documents Section
- ARGO Dashboard
- Carnegie Classification
- Control Tower
- Data Pulse
- Data Storage and Computing
- Doctoral Insights Engine
- From Vision to Precision: UTRGV’s R1 Mission
- Glossary
- Graduate Course Demand Tracker
- Graduate Help Desk
- Graduate Services Portal
-
IPEDS
- Comparing Similar Institutions to UTRGV Based on Graduate Enrollment
- Geographical Institution Graduate Enrollment
- Institution Degree Awarded Over Time
- Institution Degree Awarded Profile
- Institution Fall Graduate Enrollment Over Time
- Institution Fall Graduate Enrollment Profile
- IPEDS data dictionary
- Research Degrees Awarded Comparison
- Institute for Research on Innovation and Science (IRIS)
- NSF HERD
- Post-Award Request Portal
- Prompt Report Form
-
Reports
- Annual Report Dashboard
- Awards and Proposal Summary
- Expense Classification
- IDC Dashboard
- ORU Dashboard
- Project Burn Rate
- Project Listing
- Proposal Approvals
- Qualtrics DoR Survey Dashboards
- Research Pathways & SPI Questions
- Research Productivity
- Weekly OPS Report
- Space Utilization Dashboard
- Graduate Student Recruitment Dashboard
- Research Compliance Training
- Training and Support
Quick Links
Comparing Similar Institutions to UTRGV Based on Graduate Enrollment
This section of the IPEDS Degrees & Enrollment dashboard is dedicated to helping users compare UTRGV to other institutions with similar graduate enrollment numbers. By focusing on institutions that fall within specific percentage ranges relative to UTRGV's enrollment, this section provides valuable insights into how UTRGV's graduate enrollment and degree awards compare with those of similar institutions.
Relevant Variables:
- Degree Award Level: Users can filter results by types of doctoral degrees awarded, such as Research/Scholarship, Professional, or Other.
- Percentage Ranges: Users can select ranges (±5%, ±10%, or ±20%) to filter institutions based on their graduate enrollment in relation to UTRGV. This helps identify institutions that are either slightly or significantly similar in terms of size.
- Graduate Enrollment: This is the total count of both full-time and part-time graduate students enrolled at the institution.
- Doctoral Degrees Awarded: This variable shows the number of doctoral degrees awarded by each institution.
- Master's Degrees Awarded: This variable indicates the number of master's degrees awarded by each institution.
Visualizations:
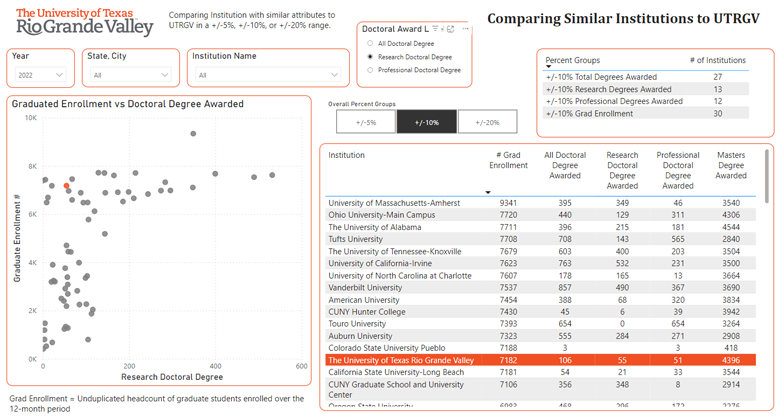
- Scatter Plot: The scatter plot displays institutions based on the total graduate enrollment (y-axis) and the number of research doctoral degrees awarded (x-axis). The color and size of each dot represent different institutions, making it easy to spot UTRGV among its peers. This visualization allows users to understand the distribution of institutions in terms of both enrollment size and doctoral degree output.
- Info Table: Below the scatter plot, the info table provides a detailed numerical breakdown for each institution, including graduate enrollment, total doctoral degrees awarded, and master's degrees awarded. This data is organized by the selected percent range (±5%, ±10%, or ±20%) and by degree award levels.
Overall Functionality: This comparison tool is designed to place UTRGV in context with other similar institutions. By examining enrollment numbers and the volume of degrees awarded, stakeholders can better understand UTRGV's position in relation to peer institutions. This information is essential for strategic planning, benchmarking efforts, and setting targets for growth in graduate programs and doctoral outputs.