Institution Fall Graduate Enrollment Profile
Institution Fall Graduate Enrollment Profile
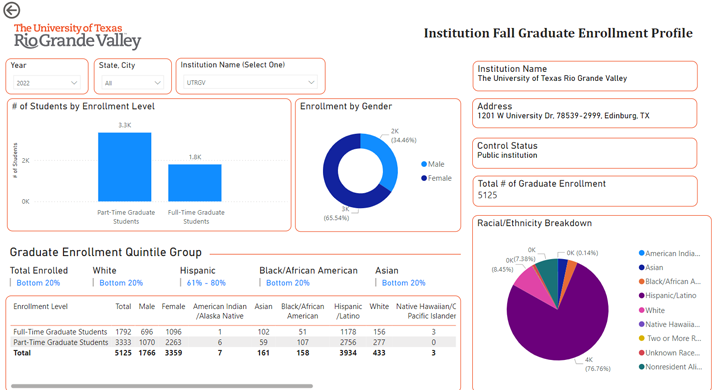
The "Institution Fall Graduate Enrollment Profile" section provides a comprehensive view of graduate enrollment demographics at an institution, highlighting key factors such as enrollment level, gender distribution, and racial/ethnic breakdown for the University of Texas Rio Grande Valley (UTRGV).
Relevant Variables:
- Graduate Enrollment Level: Differentiates between full-time and part-time graduate students, allowing users to see how many students fall into each category.
- Graduate Enrollment Quintile Group: Divides enrollment data into quintiles to show UTRGV’s standing within various demographic groups. Quintiles provide a relative comparison, categorizing institutions into groups based on their graduate enrollment counts in each demographic.
Visualizations:

- Bar Chart: Shows the number of students by enrollment level (full-time vs. part-time), providing a straightforward comparison between these two groups. This visual helps users understand whether the majority of students are enrolled full- or part-time.
- Donut Chart: Illustrates enrollment by gender, with male and female segments, displaying the percentage of male and female students. This visualization provides insight into gender representation among graduate students at UTRGV.
- Pie Chart: Offers a breakdown of graduate students by race/ethnicity, with segments for each racial/ethnic group represented at UTRGV. This chart helps users quickly grasp the diversity of the graduate student body.
- Info Table: Provides detailed demographic data for each enrollment level, including a count of students by race/ethnicity, gender, and other categories. This table allows users to see exact numbers and assess how well UTRGV is serving different demographic groups.
Overall Functionality: This page is designed to give users a deep dive into the demographics of UTRGV’s graduate enrollment, making it easy to understand the makeup of the student body in terms of part-time vs. full-time status, gender distribution, and racial/ethnic diversity. By visualizing data in multiple formats (bar chart, donut chart, pie chart, and detailed tables), this section offers a multifaceted view, enabling UTRGV to assess its representation among various groups and informing diversity and inclusion strategies within its graduate programs. This detailed enrollment profile is invaluable for administrators and stakeholders aiming to align institutional goals with demographic insights and improve the inclusivity of UTRGV’s graduate offerings.
