  • Home
  • Faculty
    • Forms, Policies, Guidelines & Procedures
    • Cayuse
    • Intent To Submit a Proposal
    • Time and Effort (T&E)
    • Funding Opportunities
    • Research Insights
    • Office of Technology Commercialization
    • Laboratory Animal Resources (LAR)
    • Institutional Animal Care and Use Committee (IACUC)
    • Institutional Review Board (IRB)
    • Institutional Biosafety Committee (IBC)
    • Travel Resources and Investments Program (T.R.I.P.)
  • Students
  • Departments
    • Research Analytics
    • Research Administration
    • Research Integrity
    • Research Enhancement
    • Clinical Research
    • Research Operations
  • Analytics
    • ARGO
    • Control Tower
    • Datapulse
    • Degree Progression Monitoring (DPM)
    • Discovery Site
    • Facuty Insight
    • Academic Analytics
    • Reports and Dashboards
  • News
    • Latest News
    • Annual Reports
    • News Archive
  • About
    • Leadership
    • Research Pathways
    • Centers and Institutes
    • Meet the Senior Vice President for Research
    • Associate Deans for Research
    • Committees
    • Personnel
    • Office Locations
  • About
DIRECTORY
MAPS
MYUTRGV
UTRGV
The University of Texas
Rio Grande Valley
DIRECTORY
MAPS
MYUTRGV
News
GIVE
Open Search Menu
Menu
utrgv logo
Division of Research
  • Home
  • Faculty
    â–¼
    Faculty Square placeholder image 300px
    Faculty

    Streamlining research processes at UTRGV. Access tools and guidance for compliance, proposal submissions, funding, and more

    • Forms, Policies, Guidelines & Procedures
    • Cayuse
    • Intent To Submit a Proposal
    • Time and Effort (T&E)
    • Funding Opportunities
    • Research Insights
    • Office of Technology Commercialization
    • Laboratory Animal Resources (LAR)
    • Institutional Animal Care and Use Committee (IACUC)
    • Institutional Review Board (IRB)
    • Institutional Biosafety Committee (IBC)
    • Travel Resources and Investments Program (T.R.I.P.)
  • Students
  • Departments
    â–¼
    Departments Square placeholder image 300px
    Departments

    The Division of Research at UTRGV is dedicated to advancing and supporting the university's research activities, benefiting students, faculty, and staff.

    • Research Analytics
    • Research Administration
    • Research Integrity
    • Research Enhancement
    • Clinical Research
    • Research Operations
  • Analytics
    â–¼
    Analytics Square placeholder image 300px
    Analytics

    The Analytics Hub provides centralized access to key tools like ARGO, Control Tower, Data Pulse, DPM, and Academic Analytics, empowering data-driven decisions across research, academics, and operations at UTRGV.

    • ARGO
    • Control Tower
    • Datapulse
    • Degree Progression Monitoring (DPM)
    • UTRGV Discovery Site
    • UTRGV Facuty Insight
    • Academic Analytics
    • Reports and Dashboards
  • News
    â–¼
    News Square placeholder image 300px
    News

    Research Communications enhances the visibility and impact of research activities across UTRGV. Our mission is to ensure that UTRGV’s research reaches both internal and external audiences, enhancing the university’s research reputation.

    • Latest News
    • Annual Reports
    • News Archive
  • About
    â–¼
    About Square placeholder image 300px
    About

    Discover UTRGV’s Division of Research, supporting high-impact research and scholarship across all disciplines.

    • Leadership
    • Research Pathways
    • Centers and Institutes
    • Meet the Senior Vice President for Research
    • Associate Deans for Research
    • Committees
    • Personnel
    • Office Locations
  1. Home
  2. Departments
  3. Research Analytics
  4. NSF HERD
  5. Comparative Summary: Benchmarking UTRGV's Research Expenditure Among Peer Institutions
In This Section
Menu

Research Analytics Menu

  • From Vision to Precision: UTRGV’s R1 Mission
  • Academic Analytics
  • ARGO
  • ARGO Dashboard
  • ARGO - Sponsored Program Intake
    • Approver Review Process
    • Communication Section
    • Compliance Section
    • Funding Source Section
    • How to Export a proposal as PDF
    • Key/Senior Personnel Section
    • Proposal Details Section
    • Proposal Information Section
    • Steps in the Key Personnel Review & Certifications Process
    • Submit for OSP Review Section
    • Subrecipient/Collaborator Section
    • Upload Documents Section
  • Carnegie Classification
    • Comparison Summary
    • Growth Rate by Institution
    • Year-over-Year (YoY) Growth Rate Comparison
  • Control Tower
  • Data Pulse
  • Data Storage and Computing
  • Degree Progression Monitoring
  • Doctoral Insights Engine
    • Dissertation Chairs Dashboard
    • Doctoral Students Info Dashboard
    • Doctoral Students Lifecycle
    • DPM Dashboard
    • Earn Rate Dashboard
    • Navigate Dashboard
  • Glossary
    • Function Glossary
    • NSF HERD - GLOSSARY
      • Type of Research
  • Grad College Smart Forms
  • IPEDS
    • Comparing Similar Institutions to UTRGV Based on Graduate Enrollment
    • Geographical Institution Graduate Enrollment
    • Institution Degree Awarded Over Time
    • Institution Degree Awarded Profile
    • Institution Fall Graduate Enrollment Over Time
    • Institution Fall Graduate Enrollment Profile
    • IPEDS data dictionary
    • Research Degrees Awarded Comparison
  • IRIS
  • NSF HERD
    • Tracking Institutional Research Expenditures Over Time
    • Comparative Summary: Benchmarking UTRGV
    • Geographical Distribution: Mapping Research Investment
    • Tree Diagram: Research by Source and Discipline
    • Expenditure by Source of Funds
    • Expenditure by Research Field/Discipline
  • Reports
    • Annual Report Dashboard
    • Awards and Proposal Summary
    • Expense Classification
    • IDC Dashboard
    • ORU Dashboard
    • Project Burn Rate
    • Project Listing
    • Proposal Approvals
    • Qualtrics DoR Survey Dashboards
    • Research Pathways & SPI Questions
    • Research Productivity
    • Weekly OSP Report
  • Training and Support
  • 30/60/90 - Day Pre-Closeout

Contact Us

Research Analytics
researchIT@utrgv.edu
(956)-882-4113

Quick Links

  • Forms, Policies & Guidelines
  • Staff Directory

Comparative Summary: Benchmarking UTRGV's Research Expenditure Among Peer Institutions

The Comparative Summary page on the NSF HERD Dashboard provides a snapshot of how institutions compare in terms of research spending. By categorizing institutions based on expenditure levels and ranking them within quintiles, this page offers a clear picture of where UTRGV stands relative to its peers and helps track progress over time.

Key Variables and Grouping Criteria

  1. Groups by Expenditure:
    • This variable groups institutions according to the new Carnegie classification criteria:
      • Higher than $50 Million: Meets R1 (Research 1) status requirement for Very High Research Activity.
      • $5 Million to $50 Million: Meets R2 (Research 2) status requirement for High Research Activity.
      • Higher than $5 Million: Includes all institutions with research expenditure exceeding $5 million.
      • All Institutions: Includes all institutions regardless of their expenditure level.
    • These groups help users quickly identify if UTRGV’s expenditure aligns with the funding levels required for R1 or R2 classification.
  2. Quintile Group:
    • Institutions are divided into five equal parts (quintiles), each representing 20% of the data, based on yearly total expenditure. The quintiles are:
      • Top 20%: Institutions with the highest research spending.
      • 21% - 40%, 41% - 60%, 61% - 80%, Bottom 20%.
    • This ranking method highlights UTRGV’s position among peers, showing whether it falls within the top or lower tiers of research spending.

The quintile groups are also applied to specific funding sources and research fields/disciplines, allowing users to analyze which areas receive higher or lower funding within each group.

Visualizations on the Dashboard

  1. Buttons (Source of Funds Detail & Field/Discipline Detail):
    • Users can toggle between two detailed views: one showing Source of Funds and another focusing on Research Field/Discipline.
    • These buttons allow users to view UTRGV’s expenditure breakdown by funding sources (e.g., federal, state, institutional funds) or by specific research fields (e.g., engineering, life sciences), making it easier to analyze spending distribution.
  2. Scatter Plot:
Scatter Plot
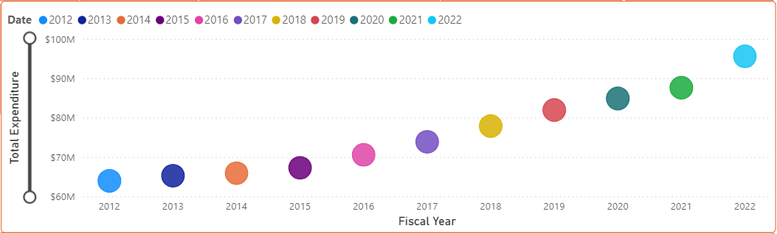
  • The scatter plot presents a timeline of UTRGV’s expenditure growth, represented by colored dots for each year. This default view allows users to see how research funding has increased over time.
  • Users can drill down to focus on specific years or filter by quintile group to compare UTRGV’s performance with institutions in the same quintile or funding category.

3. Multi-Row Card:

  • This feature displays key details for UTRGV, such as fiscal year, total expenditure, and overall quintile group. It serves as a quick reference, allowing users to easily compare UTRGV’s metrics with those of other selected institutions.
Information Table
Information Table
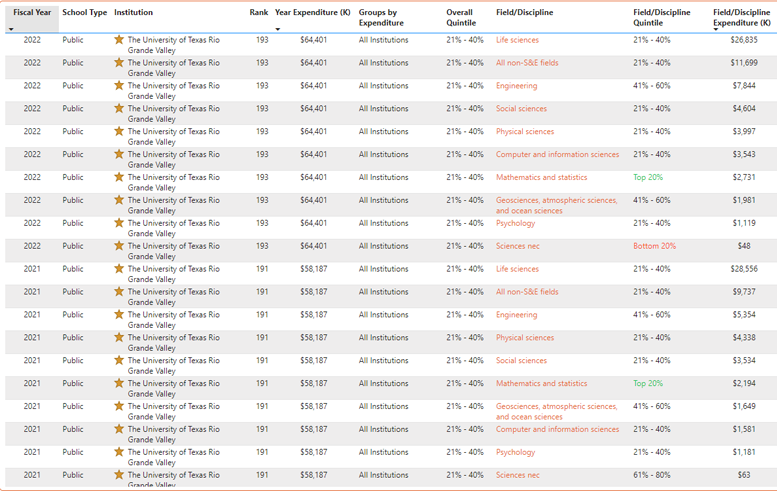
  • The table provides a comprehensive view of all selected institutions, including details such as school type, rank, yearly expenditure, groups by expenditure, and field/discipline quintiles.
  • Users can explore and compare institutions based on their specific characteristics, helping to see which institutions are leading in particular research areas or funding categories.

How to Use the Comparative Summary for Strategic Insights

The Comparative Summary page offers valuable insights into UTRGV’s research standing among peer institutions. By using the data on this page, UTRGV can:

  • Track Progress Toward Carnegie Classification Goals: By understanding how its expenditure aligns with Carnegie classification groups, UTRGV can measure its progress toward reaching R1 or R2 status.
  • Identify Funding Strengths and Gaps: The detailed breakdown by funding sources and research fields allows UTRGV to see where it excels in research investment and identify areas that may need additional support to remain competitive.
  • Benchmark with Peer Institutions: Using the quintile rankings and expenditure groups, UTRGV can benchmark itself against institutions of similar size or ranking, helping to identify realistic growth targets.

Purpose of the Comparative Summary for UTRGV’s Research Goals

This page enables UTRGV to visualize its research expenditures in a way that highlights both its strengths and opportunities for improvement. By seeing its position among peers and across different funding categories, UTRGV can make informed decisions on resource allocation and strategic planning. The Comparative Summary page is essential for understanding UTRGV’s current standing in the research landscape and for setting goals that align with its ambition to elevate its research profile and achieve higher Carnegie classifications.


Division of Research


Brownsville

research@utrgv.edu
BBRHB 2.210

(956)-296-1549

Edinburg

research@utrgv.edu
ESSBL 5.110

(956)-665-3883

Hours

Monday - Friday
8:00 AM - 5:00 PM CST

Find us on Social Media


LIKE. FOLLOW. SUBSCRIBE. ADD.


UTRGV
  • CARES, CRRSAA and ARP Reporting
  • Site Policies
  • Required Links
  • Accreditation Statement
  • Fraud Reporting
  • Senate Bill 18
  • Clery Act Reports
  • Web Accessibility
  • Mental Health Resources
  • Sexual Misconduct Policy
  • Reporting Sexual Misconduct
  • Contact UTRGV
  • 1-844-ATUTRGV
  • Facebook
  • X Twitter
  • Instagram
  • LinkedIn
  • Academics
  • Admissions
  • Cost and Financial Aid
  • Student Life
  • Search Programs
  • First-Year Students
  • Transfer
  • International Students
  • Graduate Students
  • Current Students
  • Faculty Resources
  • Staff Resources
  • UTRGV Careers
  • Visit Campus
  • Directory
The University of Texas Rio Grande Valley