Year-over-Year (YOY) Growth Rate by Institution
Year-over-Year (YOY) Growth Rate by Institution

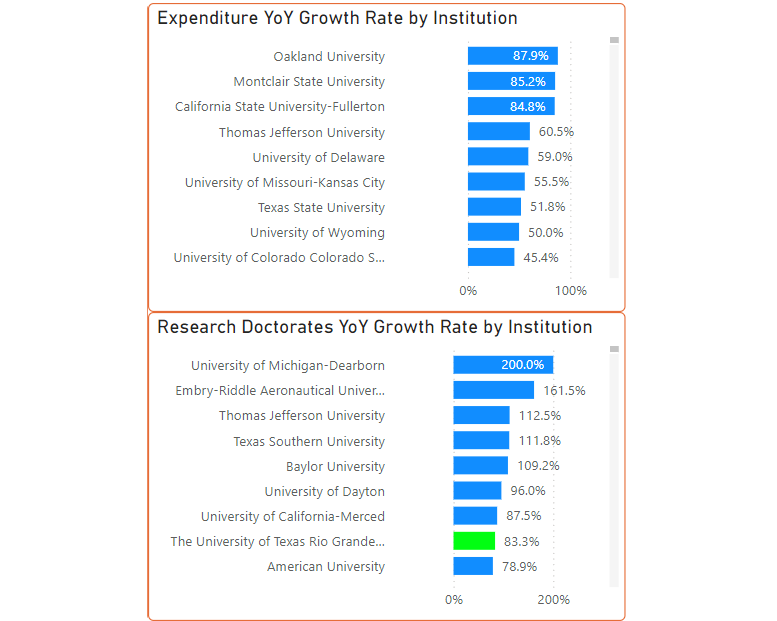
These bar charts provide a clear picture of how research institutions across the country are progressing in terms of their year-over-year (YoY) growth in two critical areas: research expenditure and research doctorates awarded. These metrics allow us to identify institutions that are making significant strides in expanding their research capacity and production each year.
Expenditure YoY Growth Rate by Institution
The first bar chart ranks institutions based on the YoY growth rate in their total research expenditure. This metric highlights which institutions are increasing their research funding most significantly compared to the previous year. For example:
- Oakland University leads with an 87.9% increase in research spending, indicating a substantial investment in research activities.
- Montclair State University and California State University-Fullerton follow closely, with growth rates of 85.2% and 84.8%, respectively.
These high growth rates suggest that these institutions are prioritizing and increasing their research funding, potentially signaling expanding research programs or new research initiatives.
Research Doctorates YoY Growth Rate by Institution
The second bar chart focuses on the YoY growth rate in the number of research doctorates awarded. This metric shows which institutions are ramping up their research degree programs and awarding more research doctorates each year. For instance:
- University of Michigan-Dearborn achieved the highest growth with a remarkable 200% increase, signifying a significant rise in doctoral research production.
- Embry-Riddle Aeronautical University and Thomas Jefferson University also show impressive growth rates of 161.5% and 112.5%, respectively.
Institutions with high growth rates in doctorate awards are rapidly expanding their research programs and contributing to the pipeline of new research professionals.
Interactive Growth Rate Sliders
To enhance the user experience, the dashboard includes sliders that allow viewers to filter institutions by specific growth ranges.
- The Research Doctorates YoY Growth Rate slider lets users focus on institutions with significant changes in doctoral production.
- The Expenditure YoY Growth Rate slider allows for a targeted look at institutions based on spending growth.
These filters provide a customizable experience, enabling users to explore institutions with notable improvements, stable growth, or other trends of interest.
Purpose of the YoY Growth Analysis
These charts provide a quick and accessible way to identify which institutions are showing rapid growth in research capacity and doctorate production. For stakeholders, researchers, and administrators, this information highlights emerging leaders in research investment and output. It also underscores the importance of steady growth in both funding and program expansion to sustain and strengthen an institution’s research profile over time.
This analysis tool makes it easy to see how UTRGV compares with other institutions in its efforts to grow research funding and increase doctorate awards, providing valuable insights for future strategic planning.
