  • Home
  • Faculty
    • Forms, Policies, Guidelines & Procedures
    • Cayuse
    • Intent To Submit a Proposal
    • Time and Effort (T&E)
    • Funding Opportunities
    • Research Insights
    • Office of Technology Commercialization
    • Laboratory Animal Resources (LAR)
    • Institutional Animal Care and Use Committee (IACUC)
    • Institutional Review Board (IRB)
    • Institutional Biosafety Committee (IBC)
    • Travel Resources and Investments Program (T.R.I.P.)
  • Students
  • Departments
    • Research Analytics
    • Research Administration
    • Research Integrity
    • Research Enhancement
    • Clinical Research
    • Research Operations
  • Analytics
    • ARGO
    • Control Tower
    • Datapulse
    • Degree Progression Monitoring (DPM)
    • Discovery Site
    • Facuty Insight
    • Academic Analytics
    • Reports and Dashboards
  • News
    • Latest News
    • Annual Reports
    • News Archive
  • About
    • Leadership
    • Research Pathways
    • Centers and Institutes
    • Meet the Senior Vice President for Research
    • Associate Deans for Research
    • Committees
    • Personnel
    • Office Locations
  • About
DIRECTORY
MAPS
MYUTRGV
UTRGV
The University of Texas
Rio Grande Valley
DIRECTORY
MAPS
MYUTRGV
News
GIVE
Open Search Menu
Menu
utrgv logo
Division of Research
  • Home
  • Faculty
    â–Ľ
    Faculty Square placeholder image 300px
    Faculty

    Streamlining research processes at UTRGV. Access tools and guidance for compliance, proposal submissions, funding, and more

    • Forms, Policies, Guidelines & Procedures
    • Cayuse
    • Intent To Submit a Proposal
    • Time and Effort (T&E)
    • Funding Opportunities
    • Research Insights
    • Office of Technology Commercialization
    • Laboratory Animal Resources (LAR)
    • Institutional Animal Care and Use Committee (IACUC)
    • Institutional Review Board (IRB)
    • Institutional Biosafety Committee (IBC)
    • Travel Resources and Investments Program (T.R.I.P.)
  • Students
  • Departments
    â–Ľ
    Departments Square placeholder image 300px
    Departments

    The Division of Research at UTRGV is dedicated to advancing and supporting the university's research activities, benefiting students, faculty, and staff.

    • Research Analytics
    • Research Administration
    • Research Integrity
    • Research Enhancement
    • Clinical Research
    • Research Operations
  • Analytics
    â–Ľ
    Analytics Square placeholder image 300px
    Analytics

    The Analytics Hub provides centralized access to key tools like ARGO, Control Tower, Data Pulse, DPM, and Academic Analytics, empowering data-driven decisions across research, academics, and operations at UTRGV.

    • ARGO
    • Control Tower
    • Datapulse
    • Degree Progression Monitoring (DPM)
    • UTRGV Discovery Site
    • UTRGV Facuty Insight
    • Academic Analytics
    • Reports and Dashboards
  • News
    â–Ľ
    News Square placeholder image 300px
    News

    Research Communications enhances the visibility and impact of research activities across UTRGV. Our mission is to ensure that UTRGV’s research reaches both internal and external audiences, enhancing the university’s research reputation.

    • Latest News
    • Annual Reports
    • News Archive
  • About
    â–Ľ
    About Square placeholder image 300px
    About

    Discover UTRGV’s Division of Research, supporting high-impact research and scholarship across all disciplines.

    • Leadership
    • Research Pathways
    • Centers and Institutes
    • Meet the Senior Vice President for Research
    • Associate Deans for Research
    • Committees
    • Personnel
    • Office Locations
  1. Home
  2. Departments
  3. Research Analytics
  4. Carnegie Classification
  5. Carnegie Classification Comparison Summary
In This Section
Menu

Research Analytics Menu

  • From Vision to Precision: UTRGV’s R1 Mission
  • Academic Analytics
  • ARGO
  • ARGO Dashboard
  • ARGO - Sponsored Program Intake
    • Approver Review Process
    • Communication Section
    • Compliance Section
    • Funding Source Section
    • How to Export a proposal as PDF
    • Key/Senior Personnel Section
    • Proposal Details Section
    • Proposal Information Section
    • Steps in the Key Personnel Review & Certifications Process
    • Submit for OSP Review Section
    • Subrecipient/Collaborator Section
    • Upload Documents Section
  • Carnegie Classification
    • Comparison Summary
    • Growth Rate by Institution
    • Year-over-Year (YoY) Growth Rate Comparison
  • Control Tower
  • Data Pulse
  • Data Storage and Computing
  • Degree Progression Monitoring
  • Doctoral Insights Engine
    • Dissertation Chairs Dashboard
    • Doctoral Students Info Dashboard
    • Doctoral Students Lifecycle
    • DPM Dashboard
    • Earn Rate Dashboard
    • Navigate Dashboard
  • Glossary
    • Function Glossary
    • NSF HERD - GLOSSARY
      • Type of Research
  • Grad College Smart Forms
  • IPEDS
    • Comparing Similar Institutions to UTRGV Based on Graduate Enrollment
    • Geographical Institution Graduate Enrollment
    • Institution Degree Awarded Over Time
    • Institution Degree Awarded Profile
    • Institution Fall Graduate Enrollment Over Time
    • Institution Fall Graduate Enrollment Profile
    • IPEDS data dictionary
    • Research Degrees Awarded Comparison
  • IRIS
  • NSF HERD
    • Tracking Institutional Research Expenditures Over Time
    • Comparative Summary: Benchmarking UTRGV
    • Geographical Distribution: Mapping Research Investment
    • Tree Diagram: Research by Source and Discipline
    • Expenditure by Source of Funds
    • Expenditure by Research Field/Discipline
  • Reports
    • Annual Report Dashboard
    • Awards and Proposal Summary
    • Expense Classification
    • IDC Dashboard
    • ORU Dashboard
    • Project Burn Rate
    • Project Listing
    • Proposal Approvals
    • Qualtrics DoR Survey Dashboards
    • Research Pathways & SPI Questions
    • Research Productivity
    • Weekly OSP Report
  • Training and Support
  • 30/60/90 - Day Pre-Closeout

Contact Us

Research Analytics
researchIT@utrgv.edu
(956)-882-4113

Quick Links

  • Forms, Policies & Guidelines
  • Staff Directory

Carnegie Classification Comparison Summary

Comparison Summary Based on New Carnegie Criteria

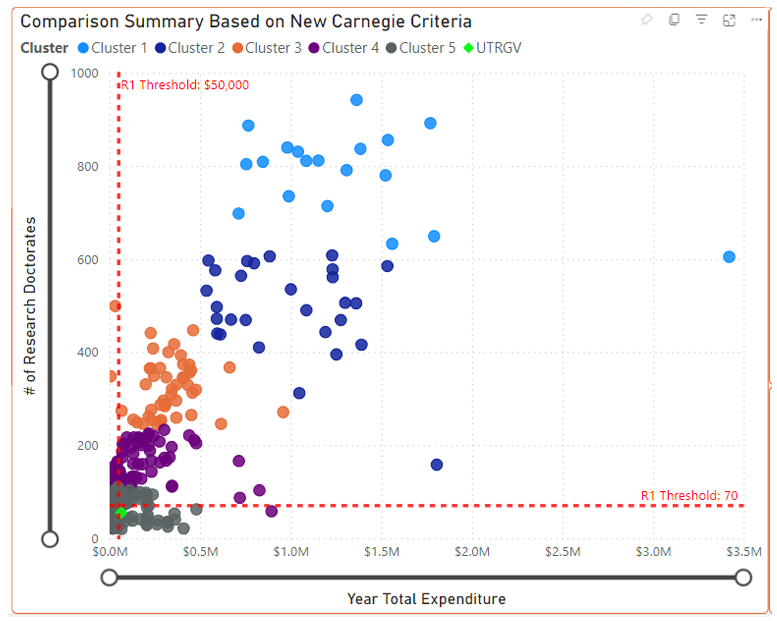
This graph offers a detailed view of how institutions measure up in terms of research investments and doctoral production, key indicators in the Carnegie Classification for doctoral universities. The Carnegie Classification is a widely recognized system that categorizes universities based on their research activity, helping to highlight institutions with significant contributions to research.

Key Variables: Expenditure and Research Doctorates

The scatter plot compares institutions using two main metrics:

  1. Yearly Total Expenditure (x-axis): This represents the total annual spending on research activities.
  2. Number of Research Doctorates Awarded (y-axis): This shows the number of doctoral degrees awarded by each institution, emphasizing the scale of its research production.

These metrics are crucial for determining an institution's Carnegie Classification status under the newly updated criteria.

Thresholds for R1 Classification

To qualify as an R1 institution (Very High Research Activity), an institution must meet the following annual thresholds:

  • Expenditure Threshold: At least $50 million in research and development spending.
  • Doctorate Production Threshold: At least 70 research doctorates awarded.

These thresholds are visually represented on the scatter plot by two red lines:

  • The vertical line at $50 million indicates the spending level needed for R1 classification.
  • The horizontal line at 70 doctorates represents the minimum doctoral production required for R1 status.

These markers allow users to see at a glance how close each institution is to achieving R1 status.

Cluster Groups and Peer Comparisons

Institutions are color-coded into five clusters based on similarities in research spending and doctoral production, making it easier to identify peer groups:

  • Cluster 1 (blue): Typically includes institutions with higher research expenditure and doctorate production.
  • Clusters 2 to 5: Each subsequent cluster represents institutions with varying levels of research intensity, with each cluster generally showing lower expenditures and fewer doctorates.

The Cluster legend allows users to quickly see which institutions are performing at similar levels, providing a comparative understanding of where each institution stands in relation to others.

UTRGV in Focus

The University of Texas Rio Grande Valley (UTRGV) is highlighted with a green diamond to distinguish it from other institutions, making it easy to spot UTRGV’s current performance relative to peer institutions. This clear marker allows for a focused comparison and helps viewers quickly understand UTRGV’s research profile within the broader landscape.

Interactive Filtering Options

The scatter plot includes several interactive filters to tailor the data view:

  • Carnegie Criteria Slicer: Allows users to filter the data by R1 or R2 criteria, focusing on institutions that meet specific research benchmarks.
  • Additional filters by state, institution type, and fiscal year enable users to narrow down the data for specific comparisons or trends.

Purpose of the Comparison Summary Graph

This visualization is a powerful tool for exploring how institutions align with the Carnegie Classification’s research benchmarks. By comparing expenditures and doctorate numbers and categorizing institutions into clusters, users gain a nuanced understanding of research intensity across universities.

The graph provides a clear and accessible way to see where each institution, including UTRGV, stands in its journey toward higher research classification, ultimately offering insight into research priorities, funding levels, and doctorate output across the nation. This comparison helps inform strategy, collaboration, and decision-making for institutional research initiatives.

Division of Research


Brownsville

research@utrgv.edu
BBRHB 2.210

(956)-296-1549

Edinburg

research@utrgv.edu
ESSBL 5.110

(956)-665-3883

Hours

Monday - Friday
8:00 AM - 5:00 PM CST

Find us on Social Media


LIKE. FOLLOW. SUBSCRIBE. ADD.


UTRGV
  • CARES, CRRSAA and ARP Reporting
  • Site Policies
  • Required Links
  • Accreditation Statement
  • Fraud Reporting
  • Senate Bill 18
  • Clery Act Reports
  • Web Accessibility
  • Mental Health Resources
  • Sexual Misconduct Policy
  • Reporting Sexual Misconduct
  • Contact UTRGV
  • 1-844-ATUTRGV
  • Facebook
  • X Twitter
  • Instagram
  • LinkedIn
  • Academics
  • Admissions
  • Cost and Financial Aid
  • Student Life
  • Search Programs
  • First-Year Students
  • Transfer
  • International Students
  • Graduate Students
  • Current Students
  • Faculty Resources
  • Staff Resources
  • UTRGV Careers
  • Visit Campus
  • Directory
The University of Texas Rio Grande Valley