  • Home
  • Faculty
    • Forms, Policies, Guidelines & Procedures
    • Cayuse
    • Intent To Submit a Proposal
    • Time and Effort (T&E)
    • Funding Opportunities
    • Research Insights
    • Office of Technology Commercialization
    • Laboratory Animal Resources (LAR)
    • Institutional Animal Care and Use Committee (IACUC)
    • Institutional Review Board (IRB)
    • Institutional Biosafety Committee (IBC)
    • Travel Resources and Investments Program (T.R.I.P.)
  • Students
  • Departments
    • Research Analytics
    • Research Administration
    • Research Integrity
    • Research Enhancement
    • Clinical Research
    • Research Operations
  • Analytics
    • ARGO
    • Control Tower
    • Datapulse
    • Degree Progression Monitoring (DPM)
    • Discovery Site
    • Facuty Insight
    • Academic Analytics
    • Reports and Dashboards
  • News
    • Latest News
    • Annual Reports
    • News Archive
  • About
    • Leadership
    • Research Pathways
    • Centers and Institutes
    • Meet the Senior Vice President for Research
    • Associate Deans for Research
    • Committees
    • Personnel
    • Office Locations
  • About
DIRECTORY
MAPS
MYUTRGV
UTRGV
The University of Texas
Rio Grande Valley
DIRECTORY
MAPS
MYUTRGV
News
GIVE
Open Search Menu
Menu
utrgv logo
Division of Research
  • Home
  • Faculty
    ▼
    Faculty Square placeholder image 300px
    Faculty

    Streamlining research processes at UTRGV. Access tools and guidance for compliance, proposal submissions, funding, and more

    • Forms, Policies, Guidelines & Procedures
    • Cayuse
    • Intent To Submit a Proposal
    • Time and Effort (T&E)
    • Funding Opportunities
    • Research Insights
    • Office of Technology Commercialization
    • Laboratory Animal Resources (LAR)
    • Institutional Animal Care and Use Committee (IACUC)
    • Institutional Review Board (IRB)
    • Institutional Biosafety Committee (IBC)
    • Travel Resources and Investments Program (T.R.I.P.)
  • Students
  • Departments
    ▼
    Departments Square placeholder image 300px
    Departments

    The Division of Research at UTRGV is dedicated to advancing and supporting the university's research activities, benefiting students, faculty, and staff.

    • Research Analytics
    • Research Administration
    • Research Integrity
    • Research Enhancement
    • Clinical Research
    • Research Operations
  • Analytics
    ▼
    Analytics Square placeholder image 300px
    Analytics

    The Analytics Hub provides centralized access to key tools like ARGO, Control Tower, Data Pulse, DPM, and Academic Analytics, empowering data-driven decisions across research, academics, and operations at UTRGV.

    • ARGO
    • Control Tower
    • Datapulse
    • Degree Progression Monitoring (DPM)
    • UTRGV Discovery Site
    • UTRGV Facuty Insight
    • Academic Analytics
    • Reports and Dashboards
  • News
    ▼
    News Square placeholder image 300px
    News

    Research Communications enhances the visibility and impact of research activities across UTRGV. Our mission is to ensure that UTRGV’s research reaches both internal and external audiences, enhancing the university’s research reputation.

    • Latest News
    • Annual Reports
    • News Archive
  • About
    ▼
    About Square placeholder image 300px
    About

    Discover UTRGV’s Division of Research, supporting high-impact research and scholarship across all disciplines.

    • Leadership
    • Research Pathways
    • Centers and Institutes
    • Meet the Senior Vice President for Research
    • Associate Deans for Research
    • Committees
    • Personnel
    • Office Locations
  1. Home
  2. Departments
  3. Research Analytics
  4. NSF HERD
  5. Expenditure by Source of Funds: Analyzing Research Funding Sources and Institutional Performance
In This Section
Menu

Research Analytics Menu

  • From Vision to Precision: UTRGV’s R1 Mission
  • Academic Analytics
  • ARGO
  • ARGO Dashboard
  • ARGO - Sponsored Program Intake
    • Approver Review Process
    • Communication Section
    • Compliance Section
    • Funding Source Section
    • How to Export a proposal as PDF
    • Key/Senior Personnel Section
    • Proposal Details Section
    • Proposal Information Section
    • Steps in the Key Personnel Review & Certifications Process
    • Submit for OSP Review Section
    • Subrecipient/Collaborator Section
    • Upload Documents Section
  • Carnegie Classification
    • Comparison Summary
    • Growth Rate by Institution
    • Year-over-Year (YoY) Growth Rate Comparison
  • Control Tower
  • Data Pulse
  • Data Storage and Computing
  • Degree Progression Monitoring
  • Doctoral Insights Engine
    • Dissertation Chairs Dashboard
    • Doctoral Students Info Dashboard
    • Doctoral Students Lifecycle
    • DPM Dashboard
    • Earn Rate Dashboard
    • Navigate Dashboard
  • Glossary
    • Function Glossary
    • NSF HERD - GLOSSARY
      • Type of Research
  • Grad College Smart Forms
  • IPEDS
    • Comparing Similar Institutions to UTRGV Based on Graduate Enrollment
    • Geographical Institution Graduate Enrollment
    • Institution Degree Awarded Over Time
    • Institution Degree Awarded Profile
    • Institution Fall Graduate Enrollment Over Time
    • Institution Fall Graduate Enrollment Profile
    • IPEDS data dictionary
    • Research Degrees Awarded Comparison
  • IRIS
  • NSF HERD
    • Tracking Institutional Research Expenditures Over Time
    • Comparative Summary: Benchmarking UTRGV
    • Geographical Distribution: Mapping Research Investment
    • Tree Diagram: Research by Source and Discipline
    • Expenditure by Source of Funds
    • Expenditure by Research Field/Discipline
  • Reports
    • Annual Report Dashboard
    • Awards and Proposal Summary
    • Expense Classification
    • IDC Dashboard
    • ORU Dashboard
    • Project Burn Rate
    • Project Listing
    • Proposal Approvals
    • Qualtrics DoR Survey Dashboards
    • Research Pathways & SPI Questions
    • Research Productivity
    • Weekly OSP Report
  • Training and Support
  • 30/60/90 - Day Pre-Closeout

Contact Us

Research Analytics
researchIT@utrgv.edu
(956)-882-4113

Quick Links

  • Forms, Policies & Guidelines
  • Staff Directory

Expenditure by Source of Funds: Analyzing Research Funding Sources and Institutional Performance

The Expenditure by Source of Funds page on the NSF HERD Dashboard offers a detailed look at UTRGV’s research funding, breaking it down by various funding sources such as institutional funds, federal and state government contributions, and other external sources. This page provides an in-depth analysis of UTRGV’s research expenditures and compares them to the average spending within its quintile group, helping UTRGV identify areas of strength and opportunities for growth.

Key Variables and Comparison Metrics

  1. Institution Expenditure (Purple Bar):
    • Represents the actual expenditure by UTRGV (or the selected institution) across different sources of funds. This data shows how much funding UTRGV received from each funding source for each fiscal year.
  2. Quintile Group Average (Green Bar):
    • Shows the average expenditure for institutions within the same quintile as UTRGV for each funding source. Quintiles are groupings of institutions into five equal parts, each representing 20% of data based on research expenditure levels.
    • Comparing UTRGV’s funding levels to the quintile average provides insights into how UTRGV’s funding stacks up against similar institutions, revealing if UTRGV is above or below average in specific funding categories.

Visualizations on the Dashboard

Expenditures by Source
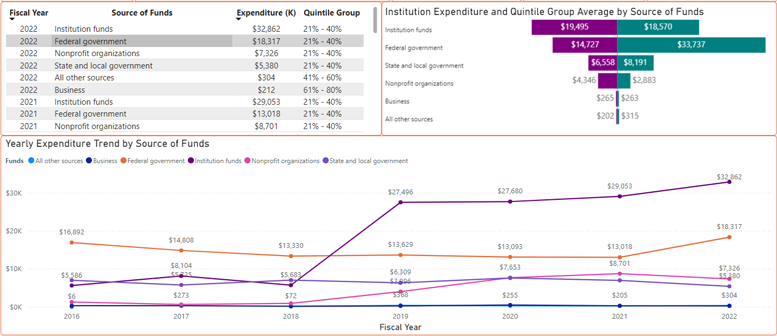
  1. Comparison Tornado Chart:
    • This unique chart compares UTRGV’s expenditure (purple bars) to the quintile group average (green bars) for each funding source. By looking at the difference between these bars, users can identify where UTRGV is performing above or below its peer average for each type of funding.
    • This visualization highlights areas where UTRGV excels, such as possibly receiving more funds from federal or institutional sources than its peers, as well as areas that may need improvement to reach or exceed the quintile average.
  2. Yearly Expenditure Trend by Source of Funds (Line Chart):
    • This line chart displays UTRGV’s funding patterns over multiple years for each source of funds, such as federal government, state and local government, nonprofit organizations, business, and institutional funds.
    • Each line represents a funding source, allowing users to see how funding levels have fluctuated over time. For example, if federal funding shows a steady increase while nonprofit funding remains flat, it indicates where UTRGV’s research funding is growing and where it might seek additional resources.
    • This historical view helps UTRGV understand long-term trends, evaluate the success of past funding efforts, and guide strategic decisions to strengthen or diversify funding sources.

How to Use the Expenditure by Source of Funds Page for Strategic Insights

The Expenditure by Source of Funds page is designed to help UTRGV analyze its funding profile in comparison to similar institutions, offering insights into funding strengths and potential gaps:

  • Benchmark Funding Levels: By comparing each funding source to the quintile group average, UTRGV can identify areas where it is leading or lagging behind similar institutions, helping to inform future funding strategies.
  • Identify Growth Opportunities: The tornado chart highlights specific sources where UTRGV may be able to increase funding, such as attracting more federal or nonprofit support if these areas are below the quintile average.
  • Analyze Funding Trends Over Time: The line chart shows how each funding source has evolved over the years, helping UTRGV recognize which funding areas are stable, growing, or declining. This view is valuable for setting future goals and ensuring sustainable research growth.

Purpose of the Expenditure by Source of Funds for UTRGV’s Research Goals

This page is a powerful tool for understanding UTRGV’s funding landscape, enabling the institution to make data-driven decisions regarding its research funding strategy. By benchmarking against peer institutions and analyzing long-term funding trends, UTRGV can:

  • Strengthen Competitive Positioning: Identifying areas where it exceeds the quintile average can help UTRGV build on its strengths and highlight successful funding strategies.
  • Address Funding Gaps: Areas where UTRGV is below the average provide opportunities to seek additional funding or develop targeted initiatives to increase support in underfunded areas.
  • Inform Strategic Planning: By understanding how funding sources impact its research activities, UTRGV can better align its research priorities with available funding, ensuring it is well-positioned for growth and progress toward higher Carnegie classifications.

The Expenditure by Source of Funds page offers UTRGV a clear, comparative view of its research funding, enabling it to enhance its funding strategy and achieve its long-term research and institutional goals.

Division of Research


Brownsville

research@utrgv.edu
BBRHB 2.210

(956)-296-1549

Edinburg

research@utrgv.edu
ESSBL 5.110

(956)-665-3883

Hours

Monday - Friday
8:00 AM - 5:00 PM CST

Find us on Social Media


LIKE. FOLLOW. SUBSCRIBE. ADD.


UTRGV
  • CARES, CRRSAA and ARP Reporting
  • Site Policies
  • Required Links
  • Accreditation Statement
  • Fraud Reporting
  • Senate Bill 18
  • Clery Act Reports
  • Web Accessibility
  • Mental Health Resources
  • Sexual Misconduct Policy
  • Reporting Sexual Misconduct
  • Contact UTRGV
  • 1-844-ATUTRGV
  • Facebook
  • X Twitter
  • Instagram
  • LinkedIn
  • Academics
  • Admissions
  • Cost and Financial Aid
  • Student Life
  • Search Programs
  • First-Year Students
  • Transfer
  • International Students
  • Graduate Students
  • Current Students
  • Faculty Resources
  • Staff Resources
  • UTRGV Careers
  • Visit Campus
  • Directory
The University of Texas Rio Grande Valley