  • Home
  • Faculty
    • Forms, Policies, Guidelines & Procedures
    • Cayuse
    • Intent To Submit a Proposal
    • Time and Effort (T&E)
    • Funding Opportunities
    • Research Insights
    • Office of Technology Commercialization
    • Laboratory Animal Resources (LAR)
    • Institutional Animal Care and Use Committee (IACUC)
    • Institutional Review Board (IRB)
    • Institutional Biosafety Committee (IBC)
    • Travel Resources and Investments Program (T.R.I.P.)
  • Students
  • Departments
    • Research Analytics
    • Research Administration
    • Research Integrity
    • Research Enhancement
    • Clinical Research
    • Research Operations
  • Analytics
    • ARGO
    • Control Tower
    • Datapulse
    • Degree Progression Monitoring (DPM)
    • Discovery Site
    • Facuty Insight
    • Academic Analytics
    • Reports and Dashboards
  • News
    • Latest News
    • Annual Reports
    • News Archive
  • About
    • Leadership
    • Research Pathways
    • Centers and Institutes
    • Meet the Senior Vice President for Research
    • Associate Deans for Research
    • Committees
    • Personnel
    • Office Locations
  • About
DIRECTORY
MAPS
MYUTRGV
UTRGV
The University of Texas
Rio Grande Valley
DIRECTORY
MAPS
MYUTRGV
News
GIVE
Open Search Menu
Menu
utrgv logo
Division of Research
  • Home
  • Faculty
    â–¼
    Faculty Square placeholder image 300px
    Faculty

    Streamlining research processes at UTRGV. Access tools and guidance for compliance, proposal submissions, funding, and more

    • Forms, Policies, Guidelines & Procedures
    • Cayuse
    • Intent To Submit a Proposal
    • Time and Effort (T&E)
    • Funding Opportunities
    • Research Insights
    • Office of Technology Commercialization
    • Laboratory Animal Resources (LAR)
    • Institutional Animal Care and Use Committee (IACUC)
    • Institutional Review Board (IRB)
    • Institutional Biosafety Committee (IBC)
    • Travel Resources and Investments Program (T.R.I.P.)
  • Students
  • Departments
    â–¼
    Departments Square placeholder image 300px
    Departments

    The Division of Research at UTRGV is dedicated to advancing and supporting the university's research activities, benefiting students, faculty, and staff.

    • Research Analytics
    • Research Administration
    • Research Integrity
    • Research Enhancement
    • Clinical Research
    • Research Operations
  • Analytics
    â–¼
    Analytics Square placeholder image 300px
    Analytics

    The Analytics Hub provides centralized access to key tools like ARGO, Control Tower, Data Pulse, DPM, and Academic Analytics, empowering data-driven decisions across research, academics, and operations at UTRGV.

    • ARGO
    • Control Tower
    • Datapulse
    • Degree Progression Monitoring (DPM)
    • UTRGV Discovery Site
    • UTRGV Facuty Insight
    • Academic Analytics
    • Reports and Dashboards
  • News
    â–¼
    News Square placeholder image 300px
    News

    Research Communications enhances the visibility and impact of research activities across UTRGV. Our mission is to ensure that UTRGV’s research reaches both internal and external audiences, enhancing the university’s research reputation.

    • Latest News
    • Annual Reports
    • News Archive
  • About
    â–¼
    About Square placeholder image 300px
    About

    Discover UTRGV’s Division of Research, supporting high-impact research and scholarship across all disciplines.

    • Leadership
    • Research Pathways
    • Centers and Institutes
    • Meet the Senior Vice President for Research
    • Associate Deans for Research
    • Committees
    • Personnel
    • Office Locations
  1. Home
  2. Departments
  3. Research Analytics
  4. NSF HERD
  5. Expenditure Geographical Distribution: Mapping Research Investment Across the U.S.
In This Section
Menu

Research Analytics Menu

  • From Vision to Precision: UTRGV’s R1 Mission
  • Academic Analytics
  • ARGO
  • ARGO Dashboard
  • ARGO - Sponsored Program Intake
    • Approver Review Process
    • Communication Section
    • Compliance Section
    • Funding Source Section
    • How to Export a proposal as PDF
    • Key/Senior Personnel Section
    • Proposal Details Section
    • Proposal Information Section
    • Steps in the Key Personnel Review & Certifications Process
    • Submit for OSP Review Section
    • Subrecipient/Collaborator Section
    • Upload Documents Section
  • Carnegie Classification
    • Comparison Summary
    • Growth Rate by Institution
    • Year-over-Year (YoY) Growth Rate Comparison
  • Control Tower
  • Data Pulse
  • Data Storage and Computing
  • Degree Progression Monitoring
  • Doctoral Insights Engine
    • Dissertation Chairs Dashboard
    • Doctoral Students Info Dashboard
    • Doctoral Students Lifecycle
    • DPM Dashboard
    • Earn Rate Dashboard
    • Navigate Dashboard
  • Glossary
    • Function Glossary
    • NSF HERD - GLOSSARY
      • Type of Research
  • Grad College Smart Forms
  • IPEDS
    • Comparing Similar Institutions to UTRGV Based on Graduate Enrollment
    • Geographical Institution Graduate Enrollment
    • Institution Degree Awarded Over Time
    • Institution Degree Awarded Profile
    • Institution Fall Graduate Enrollment Over Time
    • Institution Fall Graduate Enrollment Profile
    • IPEDS data dictionary
    • Research Degrees Awarded Comparison
  • IRIS
  • NSF HERD
    • Tracking Institutional Research Expenditures Over Time
    • Comparative Summary: Benchmarking UTRGV
    • Geographical Distribution: Mapping Research Investment
    • Tree Diagram: Research by Source and Discipline
    • Expenditure by Source of Funds
    • Expenditure by Research Field/Discipline
  • Reports
    • Annual Report Dashboard
    • Awards and Proposal Summary
    • Expense Classification
    • IDC Dashboard
    • ORU Dashboard
    • Project Burn Rate
    • Project Listing
    • Proposal Approvals
    • Qualtrics DoR Survey Dashboards
    • Research Pathways & SPI Questions
    • Research Productivity
    • Weekly OSP Report
  • Training and Support
  • 30/60/90 - Day Pre-Closeout

Contact Us

Research Analytics
researchIT@utrgv.edu
(956)-882-4113

Quick Links

  • Forms, Policies & Guidelines
  • Staff Directory

Expenditure Geographical Distribution: Mapping Research Investment Across the U.S.

The Expenditure Geographical Distribution dashboard page provides a visual overview of research expenditures by institutions across the United States, helping users understand where research funding is concentrated and how it varies by state, city, and type of institution. This visualization allows UTRGV and other stakeholders to assess how their research investments compare regionally and nationally.

Key Variables for Exploring the Data

  1. State and City:
    • This filter includes all 50 U.S. states and major cities, enabling users to focus on research expenditures in specific locations. Selecting a state allows viewers to see detailed data for all institutions within that state.
  2. School Type:
    • Institutions are classified by Public, Private for-profit, and Private not-for-profit categories. These categories help viewers distinguish between different types of institutions, which often have varying levels of research investment and funding sources.
  3. Fiscal Year:
    • The fiscal year is a 12-month accounting period used by institutions for reporting, capturing expenditures from July 1 to June 30. UTRGV began reporting data in FY 2016, and the dashboard includes data through the most recent fiscal year available, FY 2021. Users can select a specific fiscal year to analyze expenditure trends year-by-year or view data across multiple years.
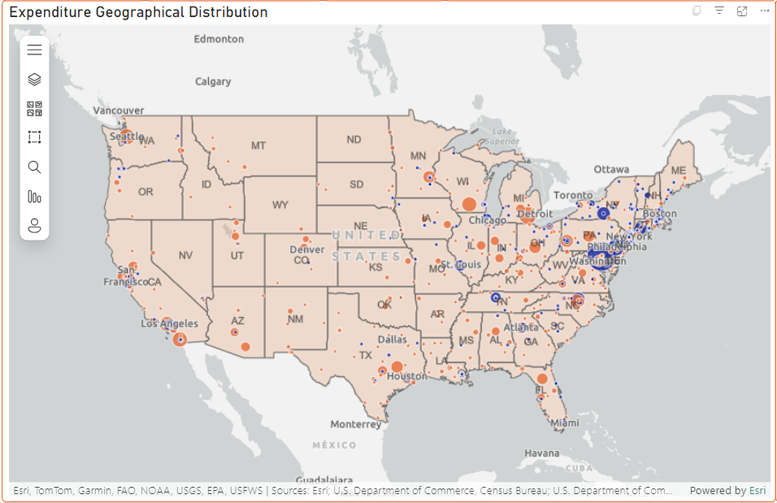
Expenditure Geographical Distribution

ArcGIS Map:

  • The map provides a clear, interactive view of research expenditures geographically.
  • Each bubble on the map represents an institution, with the color differentiating between school types (public, private for-profit, private not-for-profit). The size of the bubble indicates the amount of research expenditure—larger bubbles represent institutions with higher research spending.
  • Users can click on a state to see a breakdown of institutions within that state. The default view combines all fiscal years, but users can select a specific year from the dropdown to explore how research spending has changed over time. 
Total Expenditure by State and School

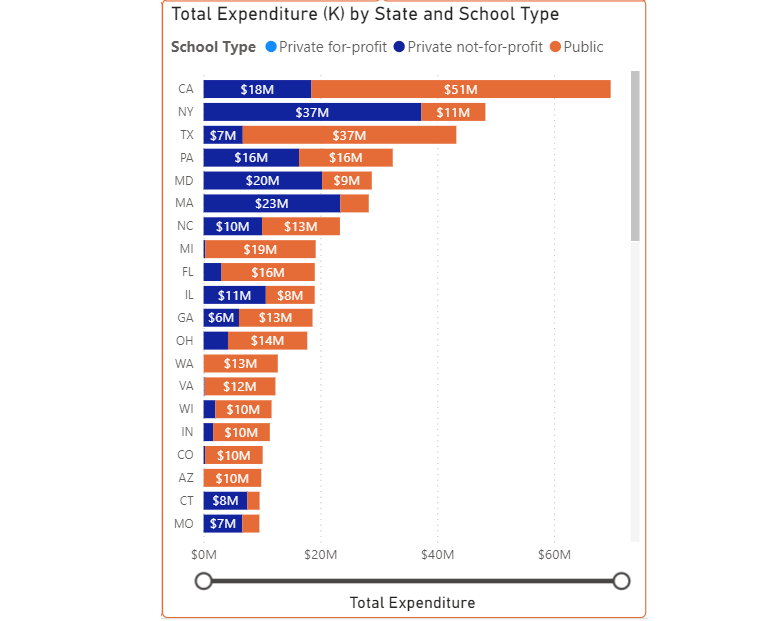
Bar Chart of Total Expenditure by State and School Type:

  • The bar chart provides an easy-to-read comparison of research expenditures by state, organized by school type. This visual is particularly useful for identifying the leading states in research investment and understanding the distribution of research funds between public and private institutions.
  • Each bar is color-coded by school type, and users can drill down to explore additional details by state, city, institution, and even specific research fields or disciplines. This chart complements the map by offering a clear, side-by-side view of expenditure levels across states, helping users quickly identify where research dollars are being invested.

How to Use the Dashboard for Strategic Insights

This dashboard serves as a powerful tool for comparing UTRGV’s research spending with other institutions across the country. It provides an accessible way to see how research investments are distributed geographically and how UTRGV fits into the national research landscape. For example:

  • UTRGV’s Research Position: By viewing research expenditures across Texas and other states, UTRGV can gauge how its funding compares to similar institutions, helping to set goals for future research investment.
  • Regional and National Trends: Observing expenditure trends across states and school types reveals areas of potential growth and collaboration. For instance, states with high private-sector involvement in research may offer unique partnership opportunities.
  • Targeted Analysis: By using the fiscal year and school type filters, stakeholders can conduct a targeted analysis, identifying where public institutions (like UTRGV) stand in comparison to private institutions over time.

This visualization is essential for UTRGV’s strategic planning in research, as it highlights funding patterns, growth areas, and competitive benchmarks, reinforcing UTRGV's commitment to expanding its research profile in alignment with national standards.

Division of Research


Brownsville

research@utrgv.edu
BBRHB 2.210

(956)-296-1549

Edinburg

research@utrgv.edu
ESSBL 5.110

(956)-665-3883

Hours

Monday - Friday
8:00 AM - 5:00 PM CST

Find us on Social Media


LIKE. FOLLOW. SUBSCRIBE. ADD.


UTRGV
  • CARES, CRRSAA and ARP Reporting
  • Site Policies
  • Required Links
  • Accreditation Statement
  • Fraud Reporting
  • Senate Bill 18
  • Clery Act Reports
  • Web Accessibility
  • Mental Health Resources
  • Sexual Misconduct Policy
  • Reporting Sexual Misconduct
  • Contact UTRGV
  • 1-844-ATUTRGV
  • Facebook
  • X Twitter
  • Instagram
  • LinkedIn
  • Academics
  • Admissions
  • Cost and Financial Aid
  • Student Life
  • Search Programs
  • First-Year Students
  • Transfer
  • International Students
  • Graduate Students
  • Current Students
  • Faculty Resources
  • Staff Resources
  • UTRGV Careers
  • Visit Campus
  • Directory
The University of Texas Rio Grande Valley