

 rotate(10)'/%3E%3Cpath d='M.038.113v.15l.15.088.15-.088v-.15L.188.025l-.15.088Z' stroke='%23c44900' stroke-width='.0375' transform='rotate(10)'/%3E%3C/svg%3E)
Annual Assessment Measures
You can find the full 2024-2025 Council for the Accreditation of Educator Preparation (CAEP) Accountability Measures information from this infographic in the 2024-2025 section below.
Measure 1 (Initial): Completer Effectiveness
UTRGV's Educator Preparation Program (EPP) presents two indicators for Measure 1, Completer Effectiveness.
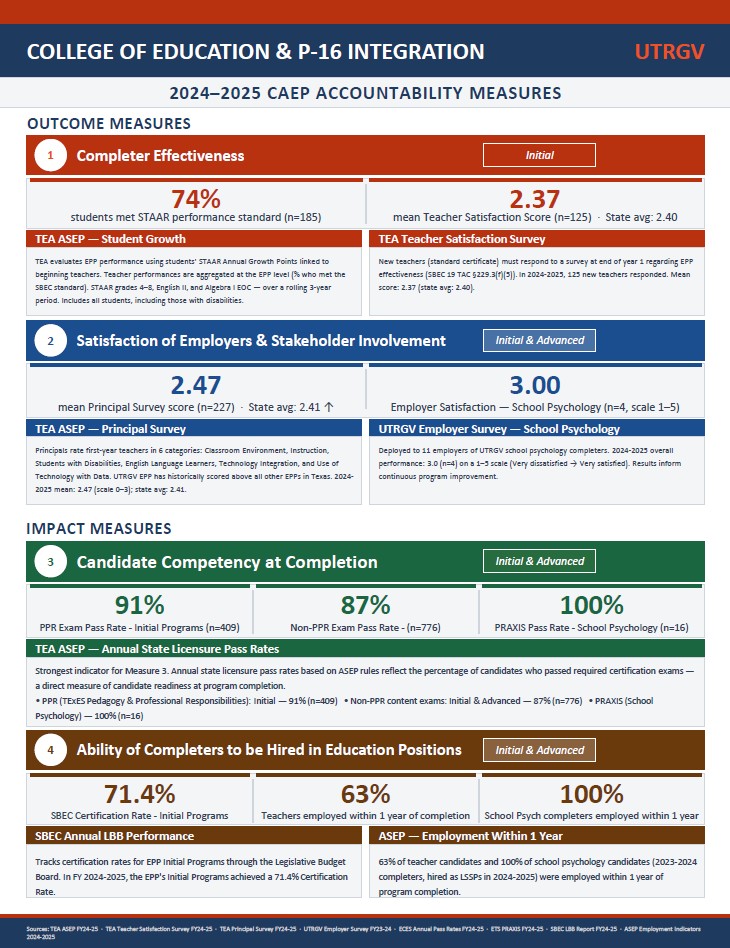
The first data source is the Texas Education Agency (TEA) Accountability System for Educator Preparation (ASEP) measure of student achievement growth in classrooms taught by beginning teachers. TEA evaluates EPP performance through a two-level aggregation process: first, each teacher is assessed based on whether their students' State of Texas Assessments of Academic Readiness (STAAR) Annual Growth Points meet the State Board for Educator Certification (SBEC) performance standard; then, individual results are aggregated at the EPP level to determine the percentage of teachers who met that standard. This calculation draws on STAAR results for grades 4–8, English II, and Algebra I end-of-course (EOC) exams, including data from students with disabilities, and is reported over a rolling three-year period. In 2024–2025, 74% of students (n=185) taught by EPP completers met the SBEC performance standard.
The second data source is the TEA Teacher Satisfaction Survey, which is administered to new teachers at the end of their first year of teaching under a standard certificate. Per 19 TAC §229.3(f)(5), all first-year teachers in Texas public schools are required to complete this survey, which measures how effectively their EPP prepared them for the classroom. In 2024–2025, 125 new teachers prepared by the EPP responded to the survey. Results indicated a mean overall satisfaction score of 2.37, consistent with the state average of 2.40.
Measure 2 (Initial and Advanced): Satisfaction of Employers and Stakeholder Involvement
The EPP presents two indicators for Measure 2.
The first is the TEA Accountability System for Educator Preparation (ASEP) Principal Survey, which measures principals' satisfaction with first-year program completers across six categories: (1) Classroom Environment, (2) Instruction, (3) Students with Disabilities, (4) English Language Learners, (5) Technology Integration, and (6) Use of Technology with Data. Historically, UTRGV's EPP has outperformed all other EPPs in the state on this measure. In 2024–2025, the EPP achieved a mean score of 2.47 compared to the state average of 2.41, indicating that principals were satisfied with completer teaching performance across all rated categories.
The second indicator is the UTRGV Employer Survey for the School Psychology Certification Program, first deployed in summer 2020. In 2024–2025, employers of school psychology completers reported an overall satisfaction score of 3.0 (n=4) on a five-point scale (1 = Very Dissatisfied to 5 = Very Satisfied).
Measure 3 (Initial and Advanced): Candidate Competency at Completion
The primary indicator for Measure 3 is state licensure pass rates as reported through ASEP. In 2024–2025, initial program candidates achieved a 91% pass rate (n=409) on the TExES Pedagogy and Professional Responsibilities (PPR) exam. Across initial and advanced programs combined, the overall pass rate on non-PPR TExES exams was 87% (n=776). Candidates in the School Psychology program achieved a 100% pass rate (n=16) on the Praxis exam.
Measure 4 (Initial and Advanced): Ability of Completers to Be Hired in Education Positions
Two indicators demonstrate the ability of EPP completers to secure employment in positions for which they have been prepared.
The first is the SBEC Annual Legislative Budget Board (LBB) Performance Measure Report, which tracks certification rates for initial program completers. In 2024–2025, the EPP's Initial Programs achieved a certification rate of 71.4%.
The second is ASEP employment data. In 2024–2025, 63% of teacher candidates were employed within one year of program completion. School psychology candidates achieved a 100% employment rate within the same timeframe.
Measure 1 (Initial): Completer effectiveness
UTRGV’s Educator Preparation Program (EPP) has identified two strong indicators for Measure 1, Completer Effectiveness. The first data source is from the Texas Education Agency (TEA) Accountability System for Educator Preparation (ASEP) Improvement in Student Achievement of Students Taught by Beginning Teachers. The scoring approach uses multiple levels of aggregation to arrive at an evaluation of EPP performance. In the first level, TEA uses each student’s State of Texas Assessments of Academic Readiness (STAAR) Annual Growth Points associated with each teacher to evaluate whether the teacher meets the State Board for Educator Certification (SBEC) standard. In the second level, the individual teacher performances (met or did not meet the standard) are then aggregated at the EPP level, and the EPP performance is determined by calculating the percentage of teachers who met the SBEC performance standard. Currently, STAAR results for grades 4–8, English II, and Algebra I end-of-course (EOC), are used. Available data from all students, including students with disabilities, are used in the calculation of this measure.
The EPP received student achievement data from the Texas Education Agency for students taught by beginning, as shown on the ASEP manual. These student data from the STAAR progress measure were generated as part of the Accountability Rating System of districts, campuses, and charter schools and aggregates it to the EPP by linking the students to the beginning teachers who have completed the EPP. The information is calculated over a 3-year period. The data shows that 74% (n=209) of students taught by the EPP’s completers met the performance.
A second data source is the TEA Teacher Satisfaction Survey. New teachers under a standard certificate must respond to a survey at the end of the first year of teaching regarding the effectiveness of educator preparation programs in preparing them to succeed in the classroom. The information gathered assists in improving the educational experience for teacher candidates through EPPs. The survey applies only to new teachers that completed an EPP in Texas. Current State Board for Educator Certification rules in 19 Texas Administrative Code (TAC) §229.3(f)(5), require each new teacher in a Texas public school to complete a survey about the effectiveness of their preparation.
In 2023-2024, 126 new teachers prepared by the EPP responded to this survey. Results indicated an overall mean score of 2.38 of overall satisfaction of the effectiveness of the EPP in preparing teacher candidates to succeed in the classroom. This is in line with the state average of 2.38.
Measure 2 (Initial and Advanced): Satisfaction of employers and stakeholder involvement
The EPP presents two indicators for Measure 2. The first is the Texas Education Agency Accountability System for Educator Preparation (ASEP) Principal Survey, an appraisal of principals’ satisfaction with program completers. The results from this survey are used for Educator Preparation Program Accountability. Principals rate first-year teachers in six different categories: 1) Classroom Environment, 2) Instruction, 3) Students with Disabilities, 4) English Language Learners, 5) Technology Integration and 6) Use Technology with Data. Historically, the EPP has scored higher than all other EPPs in the state in the principal survey. This indicates that UTRGV EPP completers are better prepared on average than the state completers. This trend has continued with results for 2023-2024 indicating a mean score of 2.36, approximating the state average of 2.38. Overall, this shows that principals were satisfied with program completer teaching performance in all categories.
A second indicator is the UTRGV Employer Survey in the School Psychology Certification Program. In the summer of 2020, the employer survey was deployed to eleven employers of UTRGV school psychology program completers. The overall performance score in 2023-2024 was a 5.0 (n=4) on a five-point scale from 1-5: Very dissatisfied -> very satisfied.
Measure 3 (Initial and Advanced): Candidate competency at completion
The strongest indicator for Measure 3, Candidate competency at completion, is the EPPs annual state licensure pass rates based on ASEP rules. In 2023-2024, the initial programs passed with an overall pass rate of 86% (n-469) on the TExES Pedagogy and Professional Responsibilities (PPR) certification exam. The initial and advanced programs achieved an overall pass rate of 88% (n=842) on non-PPR exams. The Superintendent Certification program achieved a 100% (n=8) overall pass rate on the state licensure exam, and the School Psychology program achieved an overall pass rate of 100% (n=4) on the PRAXIS exam.
Measure 4 (Initial and Advanced): Ability of completers to be hired in education positions
Two strong indicators that show the ability of completers to be hired in positions for which they have been prepared are the 1) State Board for Educator Certification (SBEC) Annual LBB Performance and 2) ASEP data that show the number of completers employed. In 2023-2024, the SBEC Annual LBB Performance Measure Report for the EPP’s Initial Programs achieved an 81.1% Certification Rate. ASEP data also indicate that in 2023-2024, 72% of teacher candidates were employed within a year of completion of the program and 100% of school psychology candidates were employed within a year of completion of the program.