FY 2023 Revenues
Figure 1 FY 2023 Budget: Projected Revenue
Revenue Projections for FY 2023 Budget
| Percent | Budget | Revenue |
|---|---|---|
| 24% | State Appropriations | 156,743,589 |
| 24% | Tuition and Fees | 151,542,631 |
| 38% | Sponsored Programs (All)* | 245,562,174 |
| 4% | Hospital, Clinics, Prof. Fees | 25,169,578 |
| 4% | Gifts and Other | 25,708,725 |
| 3% | Investment Income | 17,005,738 |
| 2% | Auxiliary Enterprises | 10,352,959 |
| 1% | Educational Activities | 6,511,664 |
The illustration above includes the funding sources available to cover the cost of all operations and activities at UTRGV. A description for each category included in the pie chart above is found in the following sections and includes typical expenses within each category.
STATE APPROPRIATIONS
The Texas state legislature meets every other year in general session and appropriates funds the ensuing two fiscal years. Work done by the university before, during, and after these sessions is important to determine an appropriation level of greatest benefit to the needs and operation of UTRGV. The timeline for the legislative budget session is included in Figure 8.
State appropriations provide support to public institutions of higher education primarily through formula funding allocations for instruction, operations, and infrastructure. Funds are used for education and general (E&G) support. Non-formula funding for specific programs or initiatives is also provided. Examples of current non-formula funding for UTRGV are comprehensive research funds, support for new academic programs start-up expenses, first year student success initiatives, Border Economic and Enterprise Development, and the Center for Manufacturing. UTRGV must present current non-formula funded items every biennium to justify continued support and may present new non-formula items to be appropriated by the state each regular session of the Legislature through the Legislative Appropriation Request (LAR) process.
The General Appropriations Act for the 2022-23 biennium contains the appropriations for each public college and university in Article III Education, Higher Education Fund. The 2022-2023 appropriation for UTRGV can be found on page III-86. UTRGV receives general academic institutions (GAI) Instructional and Operation (I&O) formula funding. Figure 2 includes the formula funding matrix with I&O funding rate of $55.66 per SCH and weights by level and discipline used to calculate formula funding. An example of calculation is also included. UTRGV also receives health-related institutions (HRI) I&O formula funding that supports the School of Medicine and eventually the School Podiatric Medicine. The current rate is $9,622 per full-time student equivalent (FTSE).
For the 2022-23 biennium, UTRGV’s GAI state appropriation, including general revenue funds for instruction and operations, infrastructure support, and non-formula support, and comprehensive research support per fiscal year is $151,914,826. The HRI appropriation including general revenue funds, infrastructure support, and non-formula support for School of Medicine is $36,923,417. UTRGV’s Operating budget includes General Revenue funds from appropriations, $156,743,589 make up the 24% of the UTRGV’s projected revenue for FY 2023 (figure 1).
INSTRUCTION & OPERATIONS FORMULA FY22 – FY23 (GAI)
Instruction and Operations Formula: The instruction and Operations Formula shall provide funding for faculty salaries, including nursing, department operating expense, library, instructional administration, research enhancement, student services, and institutional support. These funds are distributed on a weighted semester credit hours basis The rate per weighted semester credit hour for the 2022-2023 biennium is $55.66
INSTRUCTION & OPERATIONS FORMULA FY22 – FY23 (GAI) Table
| Department | Lower Division | Upper Division | Masters | Doctoral | Special Professional |
|---|---|---|---|---|---|
| Liberal Arts | 1.00 | 1.82 | 4.72 | 14.74 | - |
| Science | 1.38 | 2.75 | 7.67 | 22.30 | - |
| Fine Arts | 1.39 | 2.70 | 7.49 | 9.73 | - |
| Teacher Education | 1.40 | 1.91 | 2.34 | 8.70 | - |
| Agriculture | 1.64 | 2.33 | 8.51 | 15.18 | - |
| Engineering | 1.83 | 2.85 | 7.28 | 19.68 | - |
| Home Economics | 1.04 | 1.82 | 3.65 | 13.66 | - |
| Law | - | - | - | - | 5.56 |
| Social Services | 1.63 | 1.91 | 2.41 | 28.72 | - |
| Library Science | 2.73 | 1.99 | 3.50 | 16.55 | - |
| Veterinary Medicine | - | - | - | - | 22.77 |
| Vocational Training | 1.38 | 3.46 | - | - | - |
| Physical Training | 1.54 | 1.60 | 2.72 | 11.99 | 3.17 |
| Health Services | 0.93 | 1.60 | 2.72 | 11.99 | 3.17 |
| Pharmacy | 5.95 | 4.48 | 47.05 | 48.02 | 4.69 |
| Business Administration | 1.13 | 1.82 | 3.47 | 35.95 | - |
| Optometry | - | - | - | - | 5.76 |
| Teacher Ed Practice | 1.98 | 2.30 | - | - | - |
| Technology | 1.98 | 2.42 | 4.86 | 36.15 | - |
| Nursing | 1.35 | 2.07 | 2.68 | 10.71 | - |
| Developmental Ed | 1.00 | - | - | - | - |
Example of Calculation Based on a Matrix with 3 Elements
Semester Credit Hours (SCHs) x matrix weight x funding rate
Base year data is used
Even numbered Summer semester + following Fall and Spring semesters
THECB Cost Study
Allocate costs (direct and indirect) among disciplines and levels based on SCHs
Teaching Experience Supplement
Add 10% for undergraduate classes taught by tenured or tenure-track faculty
Example: ENGR 3301 with 25 students
TUITION AND FEES
Tuition and fees, net of discounts and allowances, make up 24% of projected revenue for FY 2023. Included in this category are statutory, designated, board authorized, differential tuition, and student fees. Current and historical guaranteed tuition rates by semester credit hour (SCH) for undergraduate and graduate students can be found in the UTRGV Tuition and Fees webpage.
In addition to tuition, UTRGV students are required to pay mandatory and incidental fees. A list of mandatory fees and current rates per SCH or student can also be found on the UTRGV Tuition and Fees webpage. Mandatory fees are those that all students must pay upon registering for credit-bearing courses every semester. Funds collected are used to provide very specific services or to offset very specific costs. Incidental fees are not automatically charged to all
students upon registration. These fees are charged only if a student opts for a specific service provided by the university. A list of current incidental fees can be found on the UTRGV - Incidental & Other Fees PDF.
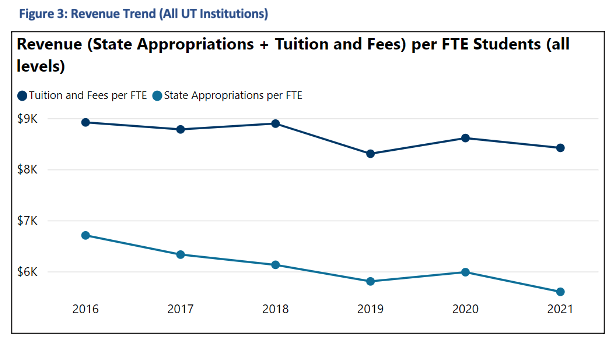
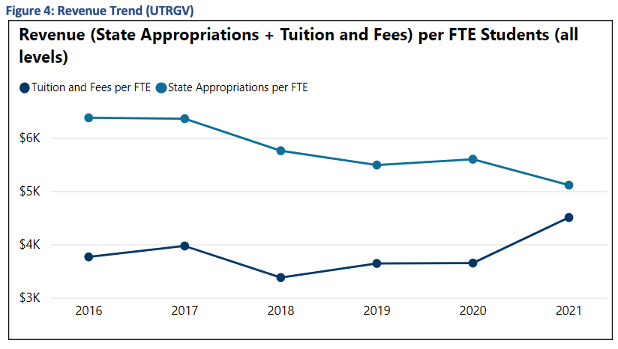
A core priority for UTRGV is to provide educational opportunities that are affordable. Figure 3 below provided by UT System’s Dashboard includes a per student revenue trend including state appropriations and tuition and fees, net of discounts and allowances, per full-time equivalent (FTE) student for all University of Texas (UT) academic institutions combined. Figure 4 is the same illustration but for UTRGV only. Although the trend for all institutions indicates a steady increase in tuition and fees that are higher than state appropriations, UTRGV’s tuition per student FTE has decreased over time and is much lower than all other UT institutions. This is due to UTRGV having one of the highest discounts in tuition, resulting in rates lower than state appropriation per student.
According to THECB’s Integrated Fiscal Reporting System (IFRS), for Fall 2021, the average total academic cost for UTRGV is among the lowest as compared to other public universities in Texas.
Resident Undergraduate Tuition & Fees - (15 Credit Hours)
| School | Cost |
|---|---|
| UT Dallas | $8,206 |
| University of Houston | $6,386 |
| Texas A&M University at Galveston | $6,365 |
| Texas A&M University | $6,358 |
| University of North Texas | $5,969 |
| Texas State University | $5,925 |
| UT Austin | $5,876 |
| UT Arlington | $5,864 |
| UT San Antonio | $5,822 |
| Texas Tech University | $5,734 |
| Sam Houston State University | $5,553 |
| Lamar University | $5,516 |
| Prairie View A&M University | $5,475 |
| Texas A&M University - Corpus Christi | $5,321 |
| Stephen F. Austin State University | $5,300 |
| Tarleton State University | $5,264 |
| Texas Woman's University | $5,166 |
| UT El Paso | $5,111 |
| Midwestern State University | $5,069 |
| Texas A&M University - Commerce | $5,013 |
| University of North Texas at Dallas | $4,759 |
| Texas A&M International University | $4,725 |
| UT Tyler | $4,669 |
| Angelo State University | $4,655 |
| UT Permian Basin | $4,647 |
| University of Houston - Clear Lake | $4,644 |
| Texas A&M University - Kingsville | $4,636 |
| West Texas A&M University | $4,610 |
| Texas Southern University | $4,587 |
| Texas A&M University - San Antonio | $4,547 |
| Sul Ross State University | $4,510 |
| Texas A&M University - Texarkana | $4,448 |
| University of Houston - Downtown | $4,414 |
| University of Houston - Victoria | $4,383 |
| UT Rio Grande Valley | $4,284 |
| Texas A&M University - Central Texas | $3,583 |
NOTES:
- Amounts represent average tuition and fees charged to resident undergraduate students enrolled in 15 semester credit hours (SCHs).
- For Fall 2021, UTRGV average for resident undergraduate enrolled in 5 SCHs was $4,284 (6% change).
- UTRGV average cost for entering freshmen students was calculated at $4,094 for Fall 2019, $4,471 for Fall 2020, and $4,782 for Fall 2021.
Source: THECB Public Universities Tuition and Fee Data as reported to the Integrated Fiscal Reporting System (IFRS).
THECB IFRS Resident Tuition Rates
SPONSORED PROGRAMS (GRANTS & CONTRACTS)
Thirty eight percent (38%) of the revenue projection for comes from externally funded federal, state, and local grants and contracts. This includes federal Pell Grant, research grants, educational grants, and contracts awarded to UTRGV for specific activities. These funds cannot be used to support university general operations, unless specifically approved by a funding agency.
HOSPITALS, CLINICS, PROFESSIONAL FEES
Four percent (4%) is generated from clinical services and professional fees, mainly from the School of Medicine. Funds are used to support clinic-related activities and to enhance specific services provided by the institution.
OTHER REVENUE
Auxiliary Enterprises are self-supporting units such as Dining Services, Campus Stores, Parking and Transportation, and the University Recreation. The estimated revenue from auxiliary enterprises reflects 2% of the FY 2023 budget.
Investment Income represents 3% of UTRGV’s budget. Interest from investment gains from university endowments finance academic support through professorships, fellowships, scholarships, research enterprise, a public service, and/or capital projects.
Educational Activities are activities that enhance academic experiences for students and the community. Some activities include Continuing Education programs and the Language Institute. These are self-supporting activities that generate revenue through fees charged for services offered. Revenue projections for in FY 2023 represent 1% of the budget.
Gifts/Other represent 4% of the budget. The institution receives gifts and donations through foundations, corporations, alumni, and friends of UTRGV. Funds are used to support academics, to support health-related services, support the research enterprise, and the provide public services.