The Limit of a Function

- Home
- How to Read a Math Textbook
- Part 1
- Part 2
- Additional Instructional Resources
- Learning Desmos
- Calculus Applets in Geogebra
- Electronic flashcards for derivatives/integrals
- Flashcards on Trig and Calculus topics
- Numerical Methods
- Functions
- Transformation and Symmetry of Functions
- Operation with Functions
- Inverse Functions
Functions as Graphs, Tables and Formulas
Objectives
- Identify if a relation is function
- Identify a function expressed in a variety of forms.
- Use the vertical test to identify functions.
Summary
A function \(f\) is a relation in which each input in a set of inputs leads to exactly one output value in set of outputs. The set of inputs are known as the domain and the set of output values are known as the range.

Figure 1: (a) This relation is a function as each input has one output. Even when two inputs like \(q\) and \(r\) have the same output \(n\), it is still a function. (b) This relation is a function as each input has one individual output. (c) This relation is not a function as the input \(q\) has two outputs, \(y\) and \(z\).
Functions may represented in different forms such as:
- Tables
- Graphs
- Formulas
Tables
Tables are a common design of representing functions. Being able to analyze a table is essential as the table’s rows or columns present the input and output values of the corresponding function. There are cases in which a table may provide multiple inputs or multiple output values of more than one function.
| Day of the Week (D) (input) | Monday | Tuesday | Wednesday | Thursday | Friday | Saturday | Sunday |
|---|---|---|---|---|---|---|---|
| Miles Driven that Day (m) (output) | 21.9 | 22.4 | 21.5 | 22.1 | 21.7 | 10.4 | 10.2 |
Table 1
Table 1: The function defined in this table is \(f(D) = m\). That means that in a given day of the week as an input will have an output of how many miles was driven that day; \(f(Friday) = 21.7\). Remember, a table does not need to be numbers as the inputs/outputs can be labels, names, days of the week, etc.
See the Desmos demonstration on Functions as Tables
Formulas
In a formula form is another way to express a function. A formula is often evaluated at different specific values. The value that is input will always produce the same output, if that is not the case then the formula is not a function.
Example: \(f(x) = 5x + x \)
The function is expressed as a formula to be evaluated algebraically. An input of x will solve for an output. Thus \(f(x) = 5x + x\) when an input of \(x=3\) give us an output of 18 which is often portrayed as \(f(3)= 18\).
See the Desmos demonstration on Functions as Formulas
Graphs
A graph is the best way to visualize a function. To analyze a function using a graph requires to find the input and the output by looking for it. That is done by looking for the input of the x value using the x-axis and finding its corresponding y-value in the y-axis, which is gives us the coordinates of the function being evaluated at.
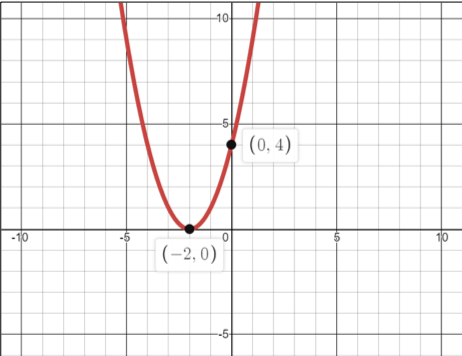
Graph 1: This is the function \(f(x) = (x+2)^2\). This graph is evaluated at two points, when \(x = -2\)and \(x = 0\) which would be the functions inputs. That would produce outputs of \(y = 0\) and \(y =4\). Thus, it is understood as \(f(-2) = 0\) and \(f(0) = 4\). Which can be represented as coordinates such as \((-2,0)\) and \((0,4)\).
An easy way to tell if a graph is a function is by using the vertical line test. By drawing a vertical line at any point of the graph, if the line intersects a graph more than once then the graph does not define a function as it states that each input must only have one output.
a) 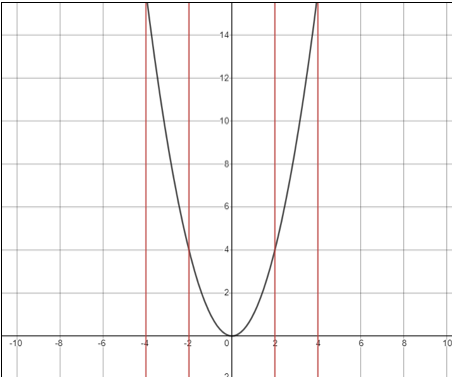 b)
b) 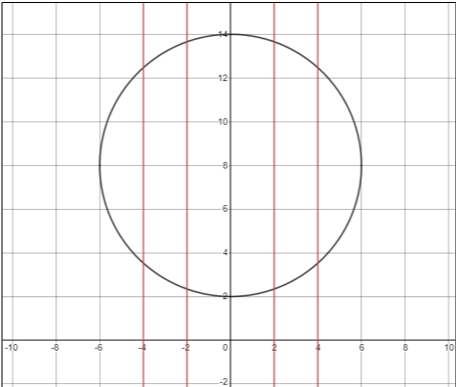
Graph 2
Graph 2: a) Using the vertical line test we can observe that the parabola is a function. b) The vertical line test shows that in a circle it intersects at two points. That determines that it is not a function as one input, x coordinate, has two outputs, y coordinate.